Today’s daily missive marks our second last publication for the year and the last of our 2021 outlooks, finishing with our multi-asset view.
While it’s useful to derive and forecast performance objectives for specific asset classes, it’s increasingly important to be aware of overarching portfolio composition – how the different assets correlate, trade (volatility), and to know both their return and liquidity profiles.
If you’re after more detail about portfolio construction, please see my notes on portfolio theory and asset allocation/selection.
Policy dominates fundamentals
Government policy has dominated economic fundamentals in 2020, as our collective optimism and strength of belief was more influential than reality and fundamentals.
We saw this where markets were trading for large periods of 2020 based on assumptions of fiscal and monetary support, or the likelihood (optimism) of a near-future release of a COVID-19 vaccine.
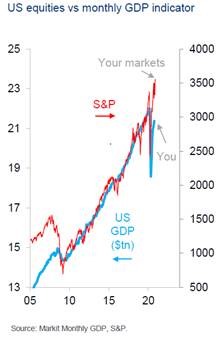
The best representation of this was comparing stock market return correlations to GDP data.
Stock prices and valuations (red line, assumptions of future growth) outperformed realised growth (blue line, fundamentals).
Said otherwise, market price returns were greater than economic growth returns.
Stimulus is the driving factor of market returns
If current levels of government stimulus and perceived future stimulus are what are driving financial markets, then fiscal and central bank policy will continue to dominate fundamentals in 2021.
Under this regime, growth will continue to outperform value.
In this case, we need to watch:
- the timeliness and protraction of stimulus,
- any suggestion of tapering this stimulus, and
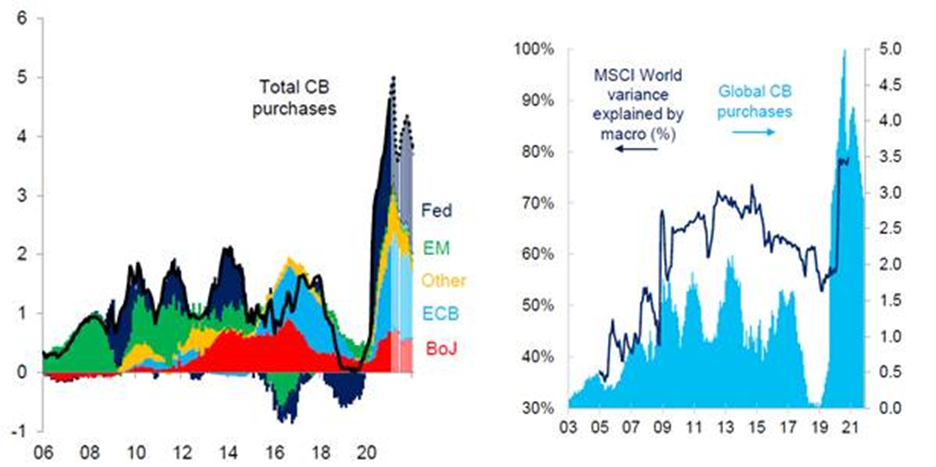
- track rolling central bank asset purchases and market liquidity.
The left-hand chart depicts total central bank asset purchases and 2021 projections, the right-hand chart shows the relationship between MSCI World equity index along with central bank purchases.
Credit expansion
The tenuous and fragile economic recovery we’ve experienced thus far has been funded by debt issuance and increases in credit issuance.
In other words, we are borrowing economic growth from the future, to realise it today.
This is why the current “expansionary” policy is producing tepid growth, as its not supported by improved fundamentals and productivity enhancement.
The following chart shows how global economic output’s impulse (a second derivative: the rate of change that the rate of output changes) is affected by central bank, Chinese and non-Chinese credit flows.
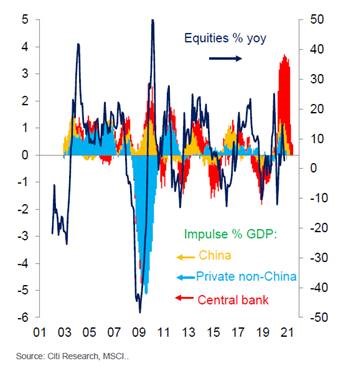
You can see from the above that the increased rate of central bank policy support (red area) was the most meaningful contributing factor to our GDP rebound as well as equity market returns in 2020.
Savings and Spending in 2021
We’ve produced comprehensive coverage of savings and expenditure this year.
Max provided company-level data, through his notes on the Buy Now Pay Later sector, and his two notes on digital payments, part 1 and part 2.
I took a different approach covering physical cash transactions, institutional cash hoarding, the spike in our household savings rate and how this is completely normal pandemic era behaviour.
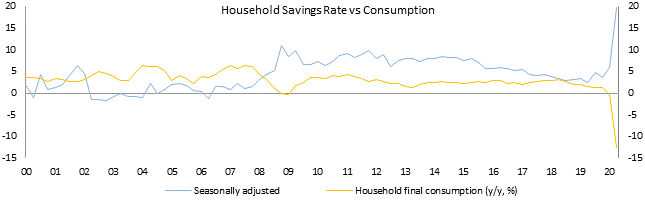
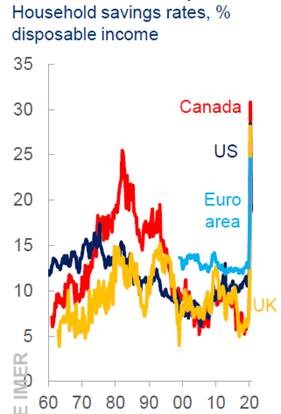
If you haven’t read any of the above articles, our national savings rate has spiked this year, where economic and social uncertainty has led to decreased domestic consumption (yellow line) and increased domestic savings (blue line).
This wasn’t a localised phenomenon.
Canada, the USA, the European Union and the United Kingdom all experienced the same spike in household savings.
In terms of industries affected by the “precautionary” savings binge, the following sectors were the most sensitive to discretionary consumption.
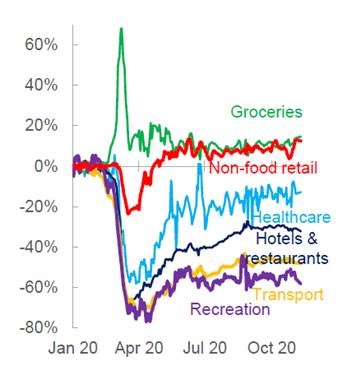
2021 is shaping up to be a year of increased consumption, albeit starting off a low base.
While savings will be slowly decumulated throughout 2021, there will be a fair degree of hesitancy based upon psychological scarring from COVID-19, employment prospects, overall health and availability of transport, recreation, hotels etc.
Inflation
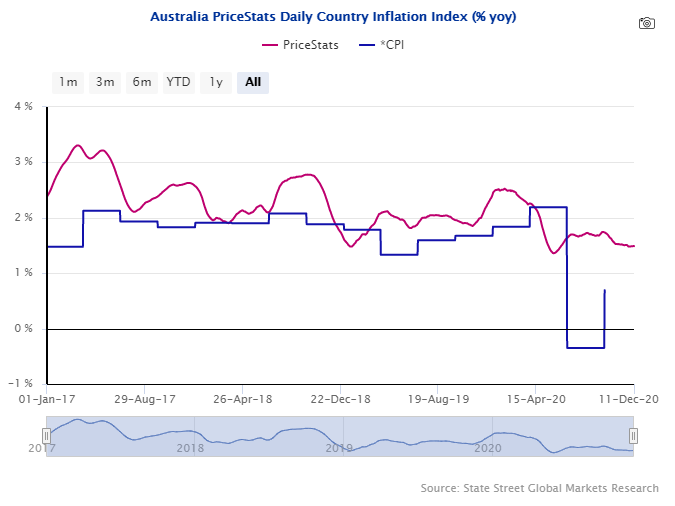
All of this suggests a modest rise in consumer prices of goods and services (CPI), though unlikely to exceed 2% over rolling 12-month periods.
This means that inflation will track below the RBA’s 2-3% per annum target, as we’ll be in a technical “disinflationary” environment.
This also means that the RBA, just like the majority of global central banks, will not be raising interest rates any time soon.
The RBA stated this in May, where Governor Lowe testified in front of our Senate and commented that getting unemployment back below 5% is their target, as until then, it’s unlikely inflation comes back to consumer prices in a sustained and meaningful way.
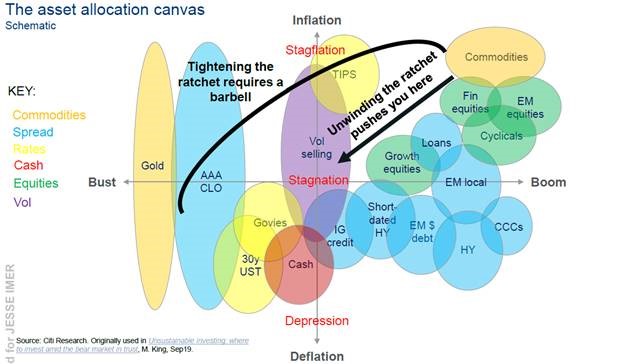
The Ratchet Effect
“The Ratchet Effect” is an instance where an ability or process is restrained and once that restraint is let go, the built-up kinetic energy causes a strong opposite reaction.
In 2020, global consumer spending has been restrained and constrained, but has the kinetic potential to move higher in 2021 as the coronavirus restraint is lifted.
This will see many equity and credit sectors rally in 2021, also while government stimulus remains supportive.
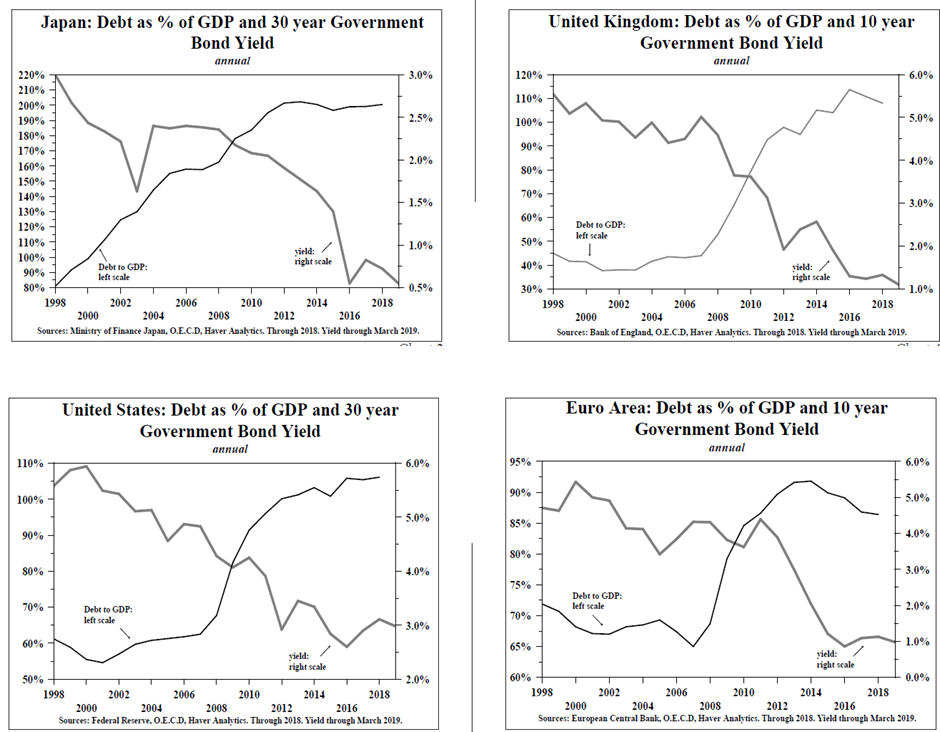
Interest rates
All of this extrapolates “lower for longer” interest rate policy and sustained low government bonds yields in the near and long term.
The amount of debt and credit expansion creates a cycle of reinforcement, where each increase in the quantum of debt requires even lower servicing costs in order to be sustained, and no material increase in taxation or reduced output (austerity).
It may sound counter-intuitive where more debt sees lower interest rates compared to higher rates, but remember, policies dominate fundamentals.
Combining all our components
In totality, these components and ideas suggest a Goldilocks economic backdrop (not too hot, not too cold) where:
- Economic growth is muted over the short- to medium-term
- Spare capacity is partially utilised (ratchet effect) but unemployment stubbornly remains high and consumers remain cautious
- Inflation can’t rise too high
This also suggests no deleveraging or austerity, where there will be increases in government debt, met with increases in central banks buying government debt (bonds).
Infrastructure spending from governments will support industrial production volumes, where specific commodities such as copper, zinc, iron ore etc will be vital.
Less indebted nations, with smaller and more nimble economies will likely out-perform (read more here), with investors in these nations receiving higher yields on bonds, better FX returns and more likely higher equity returns.
Multi-asset projections
An unwinding of the ratchet effect puts us in the middle of the below chart, where we aren’t experiencing either boom or bust, neither inflation nor deflation.
This is why we call it a Goldilocks environment.
What this suggest to us in terms of allocation is this:
Currencies – long AUD, NZD, CNH, NOK relative to USD, EUR, GBP.
Credit – long AU credit, long US investment grade bonds and high-yield, currency hedged.
Equities – long growth relative to value stocks (at least for Q1 and Q2 2021).
China – Chinese tech in particular for scale of operations, while China is a source of uncorrelated returns to most developed markets.
Emerging markets – Out-performance of EM bonds and equities over a longer-run due to higher than developed market yields/returns.
Metals/Mining – Out-performance of industrial metals such as iron ore and copper compared to precious metals gold, silver, platinum due to the “reopening” narrative. Miners that produce these may also do well.
Summary remarks
I can’t help but realise that forecasting and projecting returns, while necessary, can be irrelevant within weeks of the calendar year as events can occur out of left field.
HSBC’s head of FX trading, Brent Donnelly, wrote to his clients (including me) comparing his 2020 projections made in 2019, to his 2021 projections made this week: higher oil prices (wrong), higher inflation (wrong), weaker USD (correct), stronger global economic growth (wrong), Europe outperforming USA (wrong) and strong Asia (correct).
Funnily enough, I’ve seen similar forecasts by other strategists and market commentators for 2021.
Particularly, higher oil, higher gold, weaker USD, European equities outperforming USA etc.
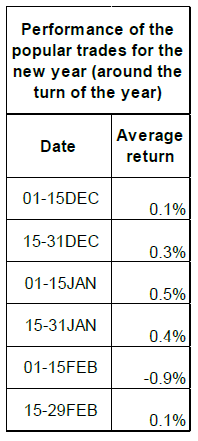
Brent did some fantastic work and found that over the last 5 years, the “trades of the year” mainly worked during December and January when they were put on – essentially a self-fulfilling cycle where Wall Street buying pushes the prices higher which translates into increased performance – afterwards turning negative as investors change their minds and events unfold.
Hence and as usual, I wish to remind everyone to remain nimble as our economic realities may differ from forecasts and assumptions.
To quote one of the world’s most influential scientists:
“If I have seen further, it is by standing on the shoulders of Giants.”
Sir Isaac Newtown (1675)
The views expressed in this article are the views of the stated author as at the date published and are subject to change based on markets and other conditions. Past performance is not a reliable indicator of future performance. Mason Stevens is only providing general advice in providing this information. You should consider this information, along with all your other investments and strategies when assessing the appropriateness of the information to your individual circumstances. Mason Stevens and its associates and their respective directors and other staff each declare that they may hold interests in securities and/or earn fees or other benefits from transactions arising as a result of information contained in this article.
