
In 1991, the total value of Japanese real estate was estimated to be USD $20 trillion, 5 times that of the entire US, despite having only a fraction of their land size.
The value of Metropolitan Tokyo alone was equal to the total value of the US, with the land just in the Emperors palace having the same value as the whole state of California, or the country of Canada.
At the time, Japanese real estate made up 20% of the world’s wealth and was twice as large as the world’s equity markets (Stone and Ziemba 1993).
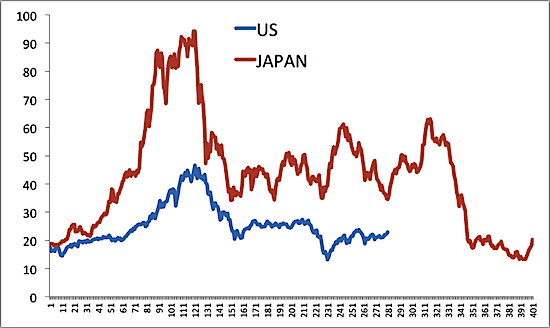
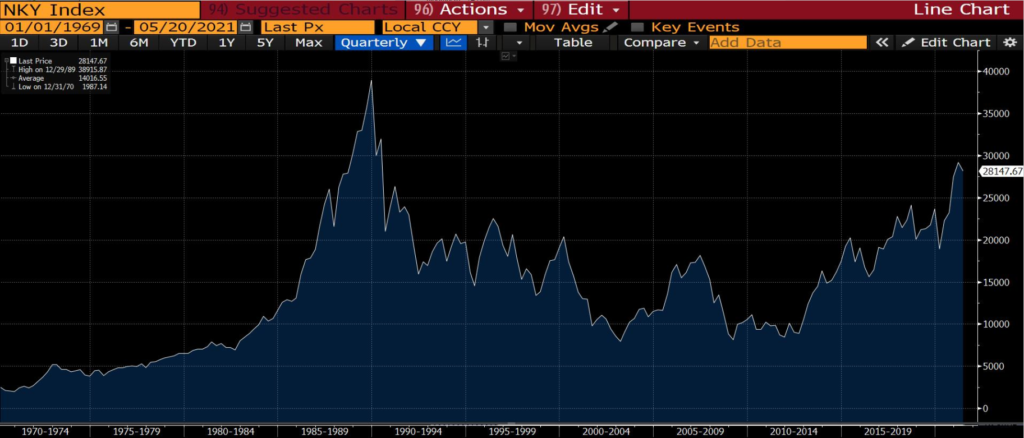
Extreme valuations were not only limited to real estate markets, with Japanese stock markets becoming even more overvalued than the US stock market would eventually become during the dotcom bubble, with its cyclically adjusted price/earnings (CAPE) ratio reaching levels almost twice as high.
US Dotcom Bubble vs Japanese Stock Market Bubble – CAPE Ratio (X axis adjusted to align the two events)
Since the collapse of their real estate and equity markets in the early 90s, Japan entered a prolonged period of low inflation and stagnant economic growth.
Many economists have since made comparisons between Japan and other developed economies, with Japan’s advanced demographic profile, with decreased fertility rates and an ageing population offering a glimpse to the future.
In today’s note, we will go over the driving forces behind Japan’s asset price bubble, what has happened since, and why Japan’s economic trajectory may or may not be relevant to developed nations in the years to come.
A Bubble Years in the Making
Post World War II, the Japanese economy quickly became an industrial powerhouse, owing to its large and growing population, and its cultural emphasis on hard-work and efficiency aiding economic production.
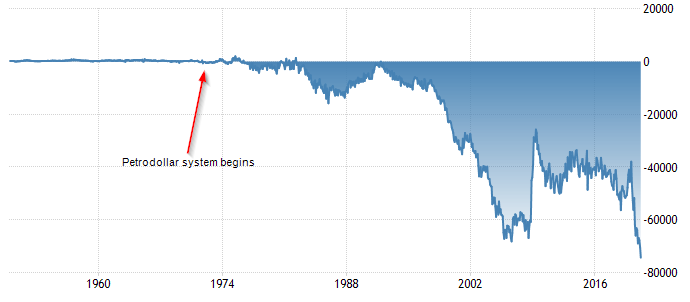
As the world progressed from the gold standard to the petrodollar system (which we have covered in the past), the United States generated global demand for its currency via major oil producers having to sell oil only in US dollars. This in turn created structural trade deficits, where the US needed to be a net importer of goods and services to provide the rest of the world with US dollars to buy oil.
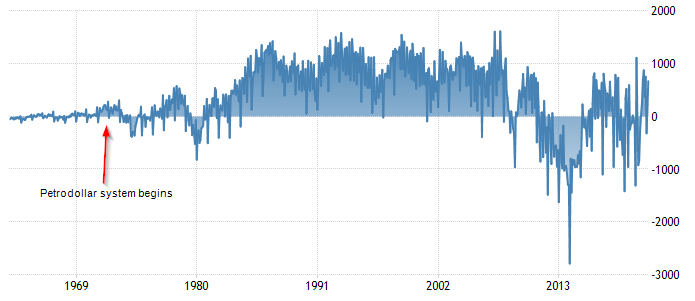
Export orientated countries like Japan were able to provide a solution to this equation, through running large trade surpluses (exporting more to the US and the rest of the world than they imported).
United States Balance of Trade
Japan Balance of Trade
Whilst this worked favourably for all parties in the starting years, worsening inflation forced Fed Chair Paul Volcker to tighten monetary policy in 1979, whilst President Reagan simultaneously deployed extensive fiscal stimulus in response to stagnant economic growth and the financial impact of the Cold War.
Whilst it assisted the economy in the short term, the combination of ~20% interest rates, and loose fiscal policy saw the USD strengthen considerably, making imports in USD terms considerably more expensive
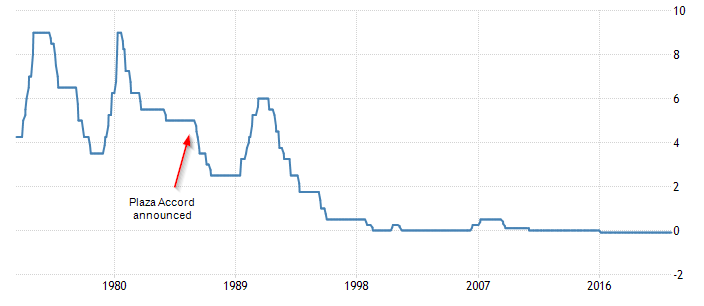
As a result, major developed economies joined to create the Plaza Accord in 1985, where an agreement was made to sharply devalue the US dollar vs major currencies, in order to bring balance to global economies and make US exports more competitive.
Whilst this assisted the global economy, exporting nations like Japan were hurt, with the strengthened Yen making their own exports less competitive.
In response to this, the Japanese Government and Bank of Japan (BoJ) employed their own loose monetary policy, financial market reform and fiscal stimulus, despite low rates of unemployment and strong economic growth, serving up the perfect cocktail to produce asset price inflation.
BoJ Interest Rates
Supportive corporate tax reform drove real estate and equity speculation, with taxation law changes in 1983 driving the majority of this, where short term gains were taxed at a lower rate than long term gains.
Companies were quickly making more from their real estate acquisitions than their actual business activities, which subsequently drove equity valuations higher. Companies like Nippon Airways traded at 1,200 times earnings at times, being deemed a ‘land play’ due to their substantial real estate holdings.
Companies funded these activities through deep European bond markets, or through domestic banks themselves, who were allowed to count 45% of their unrealised gains towards their capital requirements.
All of these reforms and low interest rates drove continual cycles of speculation. However, when markets crashed in 1987, instead of admitting a healthy pullback, the Ministry of Finance ordered four of the largest Japanese investment banks to support the stock price of NTT, one of many instances of collusion between banks.
This created a belief amongst investors that the market couldn’t fail – the government would simply step in.
Eventually, the bubble began to deflate, with stock market and real estate valuations falling steadily over the course of the following few years, thus beginning Japan’s ‘Lost Decades’ – a period of low inflation, low economic growth and the beginnings of the BoJ’s world renowned expansionary monetary policy regime.
The Land Without Rising Inflation
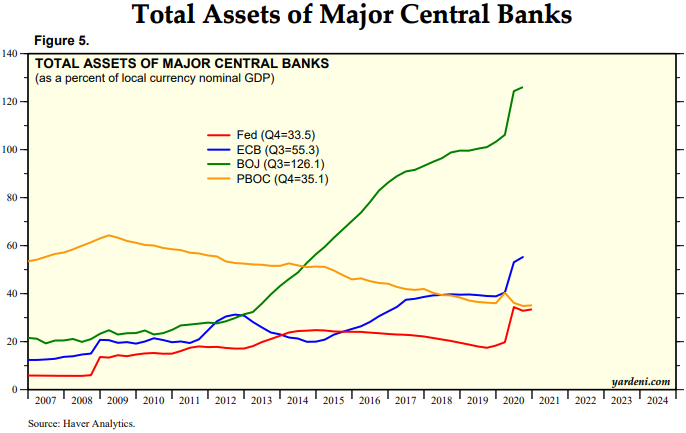
As real estate and equity markets collapsed, the BoJ started their decades-long period of expansionary monetary policy, with interest rates remaining below 1% since the mid 1990’s, Quantitative Easing (EQ) since 2001, and various other asset purchase programs.
Since then, their balance sheet has grown to over 130% of GDP, with asset purchase programs going so far as to the BoJ purchasing equities, where they now own over 75% of Japanese ETF’s, and are the largest individual shareholder in Japan.
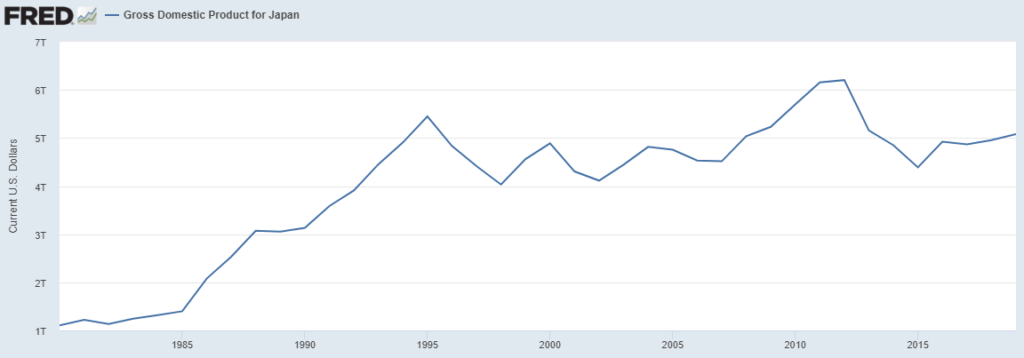
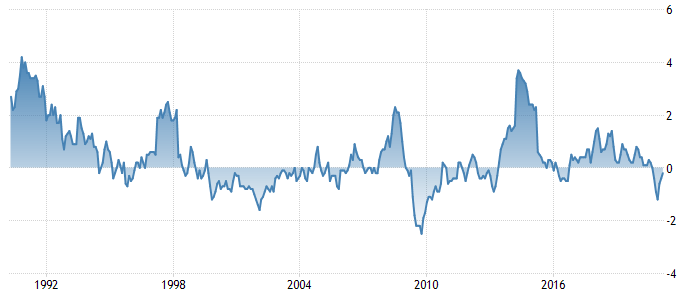
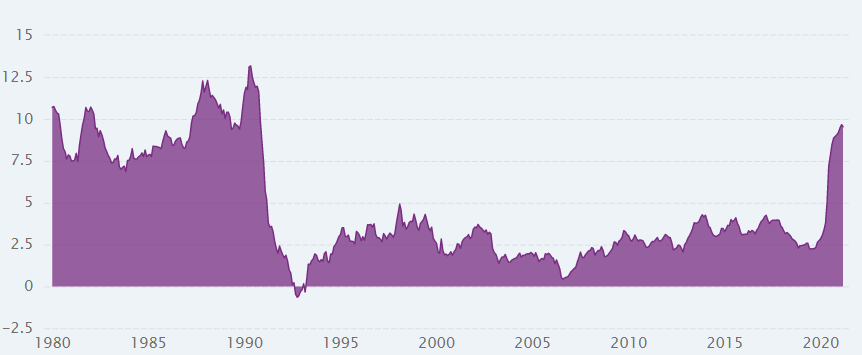
Despite these stimulatory measures, the Japanese economy has never quite recovered, with no periods of sustained inflation above 2%, and GDP still remaining below its 1995 peak.
Japan Inflation Rate (YoY, %)
Many analysts argue that countries like the U.S are set for a period of deflation, as if the BoJ couldn’t stimulate inflation after all they had done, how could the Federal Reserve and other central banks expect to do so?
There are three underlying reasons which defined Japan’s slump – demographics, culture, and productivity.
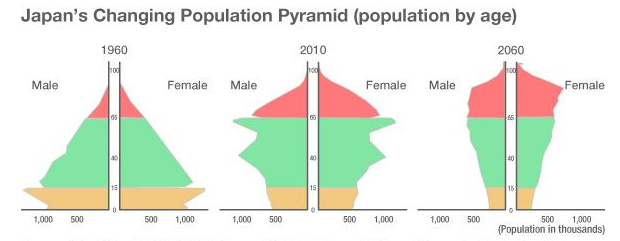
Japan’s demographic structure reflects what reality may look like for developed countries in the coming years, with increasing life expectancies and declining fertility rates combining to create reduced labour force participation, and increased burdens on public services.
Japan’s population decline is expected to continue, projected to reach less than 53 million by the end of the century, a far cry from its peak of 128 million in 2017.
Whilst Japan’s demographic issues may not be replicated to the same scale in other developed nations, given its restrictive policies and cultural stigmas towards immigration, similar trends are set to occur throughout the world (as Max touched on earlier this week in his Healthcare note) and will act as a significant deflationary force.
Japanese cultural norms have also formed the basis of an economy unconducive to inflation. Japan has historically had high household savings rates, a product of more conservative societal norms, however this has fallen in recent years due to the increasing elderly population (who by nature save less).
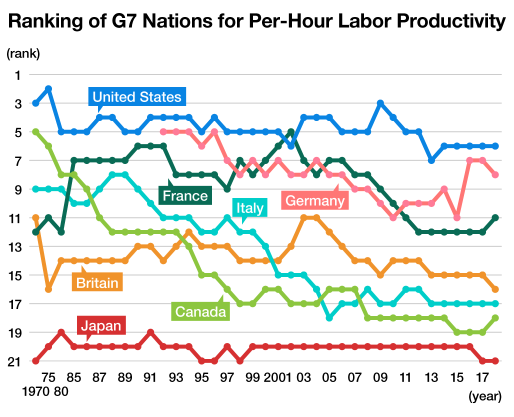
Deflation has also been driven by low levels of productivity. Despite being world renowned for their strong work ethic, they are one of the most inefficient (in terms of labour) in the developed world. Without an efficient and productive labour force, wages are unlikely to rise, and as a result, nor is inflation. Much of the productivity boosts come from the efficiency of their capital, which has less of an influence on inflation.
Why Couldn’t the BoJ Stimulate Inflation?
As a pioneer in asset purchasing programs, many look to the BoJ and to Japan as a bellwether for what inflation implications are in store for those nations who continue to expand central bank activities.
In doing so, one could arrive at the conclusion that current central bank intervention may not in fact create the inflation we all expect.
However, before making this assumption, a distinction between base and broad money must be made.
Base money (M1) refers mainly to bank reserves, with this number primarily controlled by the central bank. In Japan, as the BoJ exchanged Yen for assets on their balance sheet, base money increased sharply.
Banks then take this base money, and multiply this through the fractional reserve system to create broad money (M2), which is the currency in circulation, cash in savings and checking accounts and cash equivalents – this figure is much larger than base money and reflects what people and companies actually have to spend.
When base money increases, this doesn’t really influence inflation, except for cases of asset price inflation (which doesn’t impact upon economy wide inflation given those with assets have a higher propensity to save).
However, increases in M2 can generate inflation, given it reflects the money people and companies actually have to spend (think stimulus cheques and other measures).
In Japan’s case, there has only been a steady increase in M2, averaging 2.9% a year over the last 20 years, compared to the USA where it increased 6.2% a year.
Japan M2 Supply Growth (%)
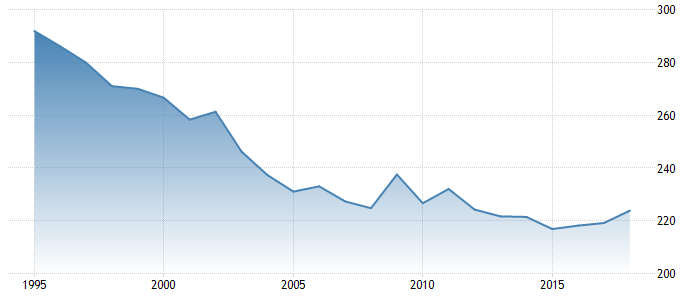
Most of this increase in base money never made it out into the ‘Main Street’, given the deleveraging of the private sector over the past 25 years. As banks attempted to lend out the increased base money available, companies did the opposite and began repaying debts, and without refinancing. Japan’s position as one of the largest creditor nations also further supported this notion, with many Japanese individuals and companies using their considerable savings base to lend and invest abroad.
Japanese Private Sector Debt to GDP
Therefore, looking at the scale of BoJ intervention and drawing conclusions on the abilities of central banks to stimulate inflation is misleading. Demographics, productivity and consumer and corporate culture all play roles in determining the extent to which base money (M1) is transmitted from bank reserves to the real world.
When looking at the US, differences in the above factors are evident, with M2 growth averaging around 6% over the past 20 years, increasing 25% in 2020 alone, reflective of strong borrowing demand and the distribution of stimulus cheques.
Where to Next?
The distinction between the Japan and other developing nations carries significant implications for inflation outlooks.
Governments and central banks akin to developed nations like Australia and the US have never conducted stimulatory activities of this scale, creating uncertain inflationary outlooks.
As we have covered in our inflation series, various asset classes can enable investors to gain positive exposure to this thematic.
Whilst inflation has been largely ignored during investment decision making over the past decade, investors must now place greater emphasis on inflationary implications when screening for investments. Inflationary forces can hold significant upside for some industries – even it is merely transitory.
The views expressed in this article are the views of the stated author as at the date published and are subject to change based on markets and other conditions. Past performance is not a reliable indicator of future performance. Mason Stevens is only providing general advice in providing this information. You should consider this information, along with all your other investments and strategies when assessing the appropriateness of the information to your individual circumstances. Mason Stevens and its associates and their respective directors and other staff each declare that they may hold interests in securities and/or earn fees or other benefits from transactions arising as a result of information contained in this article.
