
Prior to COVID-19’s outbreak, inflation – defined as a general increase in the prices of goods and services in an economy – was a small “tail” risk, assigned a low probability.
Inflationary risks always need to be assessed when building investment portfolios, as an increase in the prices of goods and services which not met with a corresponding increase in asset prices, is a net reduction in purchasing power.
For example; say your monthly household expenditure increases from $1,000/month to $1,100/month. If your income from working or investing doesn’t increase by $100, then you have less purchasing power.
Interestingly enough, a pandemic would normally produce inflation due to a contraction in the labour force, but because of our preventative measures during this pandemic, less people have died and the labour force hasn’t sharply contracted.
This pandemic out-performance, relative to prior pandemics, set the scene for a continued “deflationist” view, where prominent market commentators such as Lacy Hunt (Hoisington Investment Management) or David Rosenberg (Rosenberg Research) are continuing to prepone deflationist views.
While we can ascribe to some of these views, where bond yields are relatively constrained by the ever-growing amount of government debt which decreases economic growth trajectories, we also are pragmatists and can see the price increases of certain goods within the global economy.
Take for example this tweet that I saw last week, detailing commodity price rises over the last 12 months.
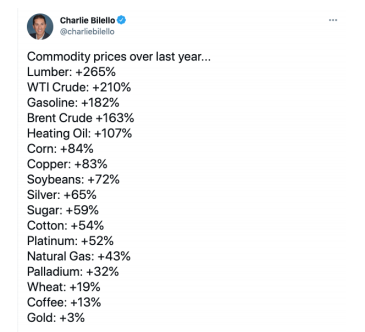
Firstly, how can you not look at this and see that there may be some inflation?
Secondly, this is why we’ve avoided gold exposure, compared to better alternatives.
The nuance is that inflation may not permeate through the entire economy, and only materialize in select assets, where there are investment opportunities to be found.
This topic of discussion is the catalyst for a genesis of Inflation Series, where we’ll be writing many subsequent notes regarding assets that benefit from inflation protection or tend to out-perform during inflationary periods.
Inflation-Linked Bonds
Enter inflation-linked bonds (ILBs), otherwise known as Capital Indexed Bonds, “Linkers” or Treasury Indexed Bonds.
Our Australian Office of Financial Management (AOFM) defines them as:
“Treasury Indexed Bonds are capital-indexed bonds with the capital value of the investment adjusted by reference to movement in the Consumer Price Index (CPI). Coupon Interest Payments will be made quarterly, at a fixed rate, on the adjusted capital value. At maturity, investors will receive the adjusted capital value of the security – the value as adjusted for movement in the CPI over the life of the bond.”
Source: AOFM, emphasis mine
This is why ILBs are a specific way to hedge against both expected and unexpected inflation increases in the future, as their capital value and coupons are explicitly linked to the Australian Bureau of Statistics (ABS) Consumer Price Index (CPI), the most commonly referenced gauge of inflation in Australia.
As they are generally government bonds issued by the Commonwealth or State government borrowing authorities, they are typically high-grade bonds with limited default risk, and higher liquidity compared to equities.
In addition to government borrowing authorities, ILBs can be issued by corporates as well, where Sydney Airport, CBA, Rabobank, Royal Women’s Hospital, Civic Nexus (Southern Cross Station) have issued ILBs in the past.
The following table can be used as a reference to compare more regular fixed or floating rate bonds, with inflation-linked bonds.
| Fixed-rate Bond | Floating-rate Bond | Inflation-linked Bond | |
| Issuers | Government and corporates | Corporates | Government and corporates |
| Principal Value | Par value (price of $100) | Par value (price of $100) | Par + inflation adjustment |
| Coupon | Fixed rate, known at primary issue | Floating rate, a fixed credit spread above reference rate | Fixed rate on principal, indexed to CPI |
| Reference Rate | None | 1m or 3m Bank Bill Swap Rate (BBSW) | CPI |
| Example Coupon | 4.5% per annum | 3m BBSW +2.5% p.a. | CPI+2.5% p.a. |
| Quotation | Nominal Yield (inc inflation) | Nominal Yield (inc inflation) | Real yield (ex-inflation) |
| Hold to Maturity Return | Yield from coupons | Yield from coupons | Real yield plus inflation index |
| Upside factor | Yields decline | Yields rise | CPI increases more than projected |
| Downside factor | Yields rise | Yields decline | CPI declines more than projected |
Market Projections for Inflation
Bond markets have a deductive indicator for inflation, dubbed “break-even inflation” or BEI for short.
Break-even inflation is the subtraction of inflation-linked bonds of a specific term, from the fixed-rate yield of a fixed-coupon bond of a specific term.
For example:
10-year BEI = 10y Cwth govt issued fixed-rate bond – 10y Cwth govt issued ILB
Real world example:
10y BEI = 1.73% – -0.54%
10y BEI = 2.27%
Said otherwise, the market is currently projecting that Australian inflation will average 2.27% per year, for the next 10 years.
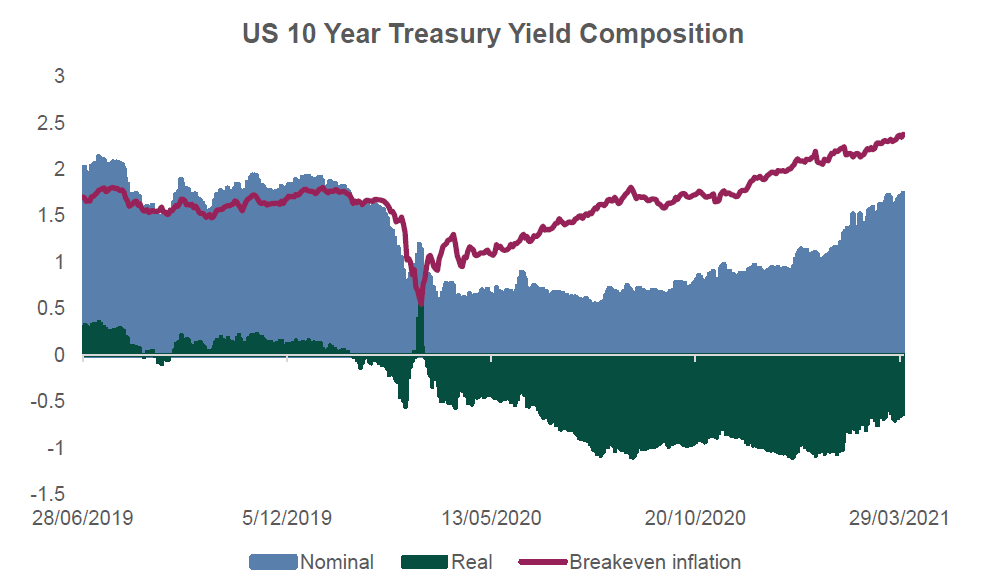
If you attended our recent Mason Stevens Credit Fund Q1 2021 webinar, you would’ve seen this chart presented, where we analysed the components of inflation forecasting, within the US bond market:
Therefore, if inflation was to average higher than this rate for the 10-year period, inflation-linked bonds are an effective hedge to this scenario as their capital price will increase through the higher CPI indexation.
Conversely, if inflation is to average lower than this rate for this period, fixed-rate bonds will have more upside potential due to the lower indexation of ILBs, compared to the nominal rate of return of fixed-rate bonds.
A Starting Point
It becomes clear that inflation-linked bonds are an effective hedge against inflation, due to the indexation of coupon payments to the Consumer Price Index.
However, their upside potential is limited to the measurement of CPI, and CPI rising above the market’s break-even inflation forecast.
And hence this inaugural note of our Inflation Series, where our upcoming notes will analyse the other markets benefitting from rising goods and services pricing, seen in the original Twitter screenshot.
These markets include lumber, agriculture, precious metals, industrial metals, and cyclical equities – and all have avenues for investment, depending on your inflation thesis.
The views expressed in this article are the views of the stated author as at the date published and are subject to change based on markets and other conditions. Past performance is not a reliable indicator of future performance. Mason Stevens is only providing general advice in providing this information. You should consider this information, along with all your other investments and strategies when assessing the appropriateness of the information to your individual circumstances. Mason Stevens and its associates and their respective directors and other staff each declare that they may hold interests in securities and/or earn fees or other benefits from transactions arising as a result of information contained in this article.
