
We’ve been hearing non-stop news this year about supply-chain disruptions, reduced supply and higher input costs as part of manufacturing and agriculture.
We’ve seen this first-hand through higher prices of wheat, corn, barley, oil, timber, iron, copper, bitumen, houses, cat food etc, but yet we’ve only seen muted inflation data thus far, as measured by Consumer Price Indexes (CPI).
This has made us a little sceptical. Corporate revenue has been affected by higher costs and we’re seeing higher costs of goods in stores and in futures markets, so why haven’t we seen the higher prices reflected in CPI?
Enter Hedonism
Hedonism refers to behaviours and interactions that are pleasure seeking, where a being will seek pleasure with respect to pain.
Hedonic adjustments are utilised by economists and statisticians to measure the pleasure or utility, to derive pleasure-adjusted or utility-adjusted economic data.
Statistics bureaus use hedonic adjustments when calculating CPI, where CPI is conventionally used to measure inflation – general increases in the prices of goods and services.
Sounds strange doesn’t it?
We commonly use CPI to measure inflation, but we aren’t measuring raw price changes – we’re measuring the pleasure-adjusted or utility-adjusted price changes, which can be vastly different.
In fact, the result over the past 30 years has been a massive differential between real price movements and hedonic-adjusted price movements.
This should enrage anyone who receives a defined benefit payment, or anyone working in industries under collective bargaining agreements that increase wages in line with CPI, rather than real-world inflation.
A Hedonic Adjustment Example
You have a bag of M&Ms that contains 100 little chocolates and costs $1 per packet.
Mars Inc. (the producer of M&Ms) finds a way to fill each bag with 110 M&Ms and raises the price to $1.10 per packet.
Using a hedonic adjustment, we would adjust the $1.10 bag back down to $1.00, as each M&M only costs 1c each.
Therefore, cost of living has gone up by 10% ($1.0 to $1.10), but the hedonic-adjusted price has not changed ($1.0 to $1.0).
Hedonics in Practice
Looking at how statistics bureaus use hedonic quality adjustments, it’s obvious they track some sort of quality or total utility metric, over time, with varying assumptions.
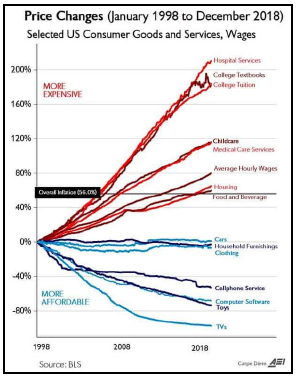
This is the only way that they can realistically account for car prices going sideways, or state that TV prices have declined 80%, when in raw price terms, prices are generally higher.
Take for example the price of a standard 1990 Honda Accord, that cost $12,000 USD at the time, where the 2020 version costs $25,000 USD now.

Or for another example is a Ford Mustang, which cost $9,000 USD in 1990, or $27,000 USD now.

Now, a non-statistician would simply derive the price differential between the two to calculate the price rise.
i.e. Honda Accord price has increased 208%; Ford Mustang price has increased 300%.
However, that type of analysis would not pass at a statistics bureau, where they would adjust the price lower, to account for the increased utility (or pleasure) that the 2020 model has compared to the 1990 version.
This is a complex equation based on assumptions of utility regarding GPS, ABS, better fuel consumption, computer assist etc.
For the mathematically minded amongst us, hypothetical models for car prices would look like this:
Raw-price change:
Log(price) = Beta1 + B2(2020 model price) – B3(1990 model price)
Hedonic-adjusted price change:
Log(price) = Beta1 + B2(2020 model price) – B3(1990 model price) + B4(GPS) + B5(computer assist steering) + B6(fuel consumption) + B7(engine capacity) + B8(trunk capacity) + e
The hedonic-adjusted price has a lot of assumptions underpinning the price change, which may not hold in reality and depending on the different car manufacturers and models.
As such, the US Bureau of Labour Statistics (BLS) records that US new vehicle prices have gone sideways these last 30 years (red line), rather than up 200-300% (green line).
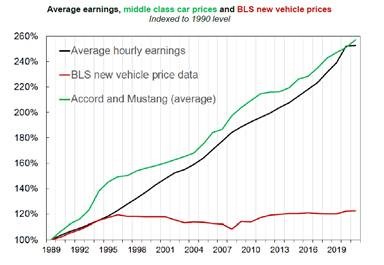
Source: BLS, HSBC
Not a Cost of Living Index
This is why CPI no longer reflects costs of living as measured by consumer spending. It reflects the cost-adjusted price based on the utility or pleasure we receive from advances in technology.
This may be seen as a BETTER measure for our economic prosperity, but it doesn’t help any consumer when central banks look at inflation data at “low” levels of 0-2%, when really the nominal figure is far higher.
Alternative Measures of Inflation
The failings of CPI have been well known for decades already, where the problem isn’t the methodology, but how we use it.
CPI isn’t broken – it fairly accurately measures utility-adjusted changes in prices. But what we shouldn’t be doing is using CPI to benchmark wages/salaries or superannuation benefits.
This has given rise to other measurements, which are slowly gaining alternative popularity.
A favourite of mine is called PriceStats, which collects daily online price data on over 5 million different products sold by hundreds of retailers across more than 70 countries.
This data mainly covers goods including food and beverages, clothing, energy, healthcare, real estate, furniture and electronics – the vast majority of household expenses.
The RBA has looked at the methodology before, which they noted includes “volatile” items such as food and energy.
This is laughable, as why would we ignore key components of household spending such as food and energy, simply because they’re volatile? These items and their corresponding prices are a key part of life for the majority of the world.
Below is PriceStats measure of Australian inflation (orange) versus the ABS Consumer Price Index (blue).
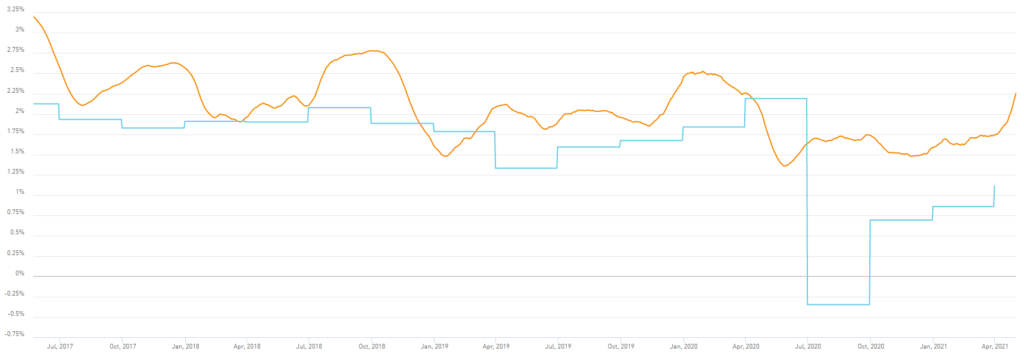
Source: Pricestats, State Street
You may notice that PriceStats measurements consistently reflect higher inflation than CPI, over the past 5 years?
By PriceStats gauge, Australian inflation is already well within the RBA’s 2-3% target band, whereas by CPI, we’re languishing well below at 1%.
And if we make the same comparison in the USA, PriceStats is more closely related to BLS CPI, though has already tracked higher in 2021 where there is a growing disparity.
It’s worth remembering that PriceStats takes DAILY measurements of inflation, which are released three days later, whereas the ABS records inflation QUARTERLY, which is released nearly 2 months AFTER the end of the period.
i.e. Q1 2021 (Jan-Mar) inflation data was released in late April, a long period later.
This is why PriceStats is imminently suitable for central banks to measure ongoing inflation, lest they be caught well behind the inflation curve, which seems to be happening in the US already.
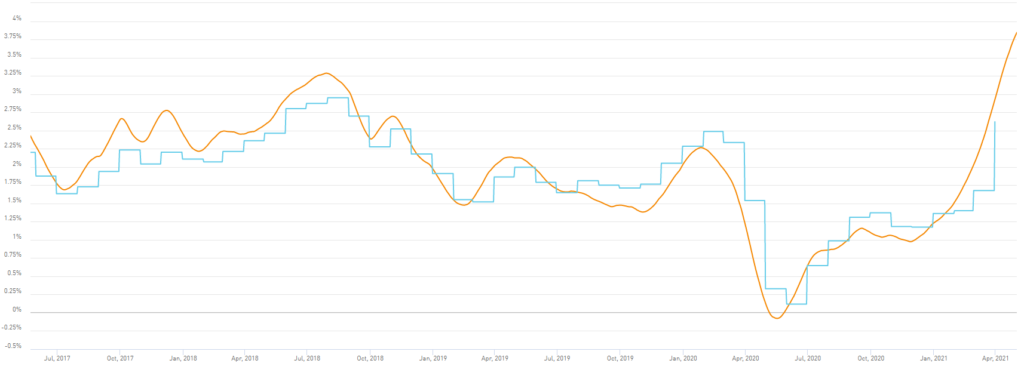
Source: Pricestats, State Street
Closing Remarks
As investors, an erosion of our purchasing power is the antithesis of our goals.
We seek to preserve the value of capital, and where possible and applicable, increase the value of said capital.
The under-measurement of CPI is reason enough to be aware of inflation impacts that increase costs of living, where if there is not a subsequent appreciation in financial asset prices, our purchasing power may be eroded.
This is the catalyst for our Inflation Series, where we’re seeking investments that have direct relation to higher real-world prices.
If you haven’t seen them, we’ve so far covered:
And some of the reasons why we see inflation:
- Chinese demand for materials
- Conflict between USA and China in Asia Pacific
- Shortages in US residential property supply
- Demographic change
- RBA policy settings
- US stimulus
The views expressed in this article are the views of the stated author as at the date published and are subject to change based on markets and other conditions. Past performance is not a reliable indicator of future performance. Mason Stevens is only providing general advice in providing this information. You should consider this information, along with all your other investments and strategies when assessing the appropriateness of the information to your individual circumstances. Mason Stevens and its associates and their respective directors and other staff each declare that they may hold interests in securities and/or earn fees or other benefits from transactions arising as a result of information contained in this article.
