
One of the tell-tale signs of the US housing bubble and the subsequent subprime mortgage crisis and credit crisis – later labelled the Global Financial Crisis or Great Recession – was a surge in house prices that peaked in 2006, reaching the low point in 2012.
One of the most cited reasons that supported the US housing bubble was the ultra-accommodative interest rate policy put forth by the US Federal Reserve, who was slow to raise interest rates because they were not seeing inflation evident, resulting in higher costs of living.
But the truth of the matter was that household costs of living, real-world and “true” inflation, had been rising for years.
Yet the Fed did not see inflation because how of how we measure house price inflation.
Owner’s Equivalent Rent (OER)
Statistics bureaus often use data sources that provide equivalence or inference, as a substitute for real data sources.
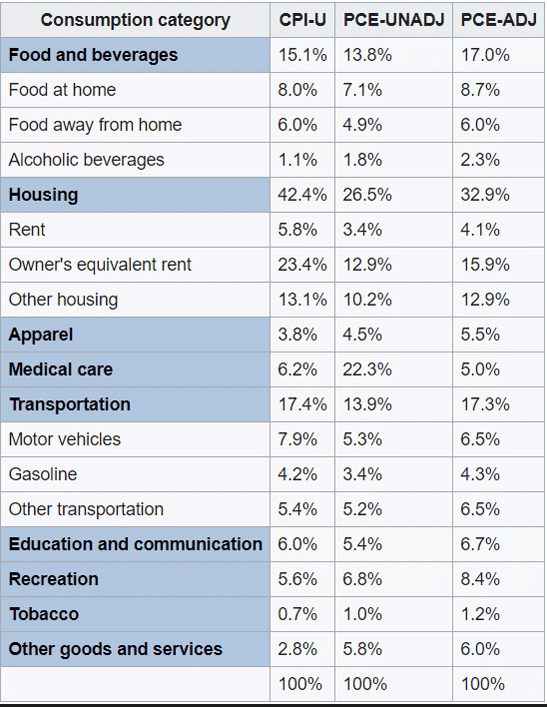
When they measure household rents as part of measuring and recording the Consumer Price Index (CPI) or Personal Consumption Expenditures (PCE), the biggest components are to do with rent.
Source: Wikipedia
Notice that OER is 23.4% of total CPI where aggregate housing expense is 42.4%?
OER is the amount of rent that would be paid in order to substitute a currently owned house as a rental property, also referred as “rental equivalent”.
In other words, it calculates the equivalent expense of owning a property (borrowing costs, taxes etc.) instead of actual rental and ownership costs.
The reason for this is that you don’t actually “consume” housing for it to be part of consumer price indices such as CPI and PCE.
You consume the shelter it provides you, but you don’t actually consume the house or land itself. It’s a subtle distinction.
Shelter is a service that can be measured; house prices are a capital good – an asset class. The former you consume, and the latter you invest. Since 1981 statistics bureaus haven’t measured housing prices directly, they’ve used OER.
In the USA, the Bureau of Labor Statistics (BLS) record observations for OER quite arbitrarily by asking this general question:
“If someone were to rent your home today, how much do you think it would rent for monthly, unfurnished and without utilities?”
See the problem?
This is a subjective question that makes OER more-or-less uninformed guesswork.
Historical OER and Inflation
Back in the early 2000s, OER was quite flat for the period, which is why the Fed did not see the real-world inflation.
Below, we chart US OER (red) versus US House prices (blue).
OER annualised 1-3% during the 2000-2007 period, while house prices were increasing by 8-15% p.a.
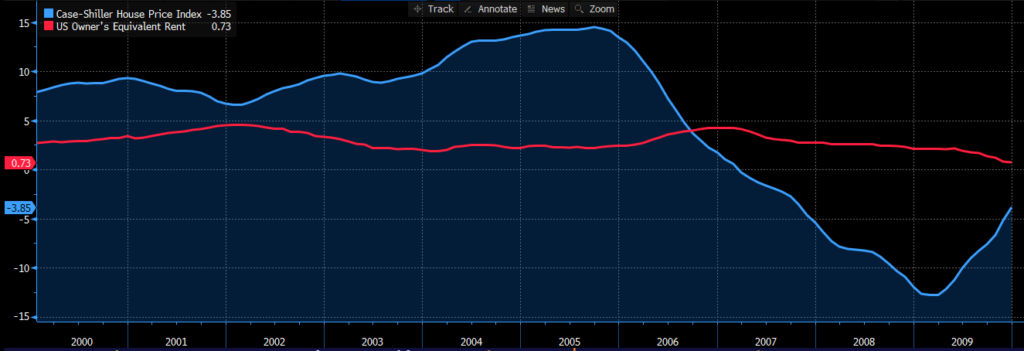
Source: Bloomberg
As CPI informs us, rent/housing accounts for ~40% of household budgets so hence, price changes have a large effect on resulting CPI estimates.
Thinking about this mathematically:
- If dwelling expenses account for 15% of household budgets, then a 10% rise in dwelling costs should see a 1.5% rise in CPI, without factoring in ANY other price rises.
- The inflation base would be 1.5% p.a., then after adding any incremental rises in healthcare, education, fuel and food costs etc., likely it would have historically been 3-4% or higher.
i.e. inflation would’ve been at the top end of the Federal Reserve’s target, and they would’ve been hiking interest rates.
Instead, and by using OER, that 15% weighting *1% meant that the CPI housing expense inflation was only ~0.15-0.3%, very low.
Which is why the Fed kept their Fed Funds Rate low (white line) because OER was quite flat.
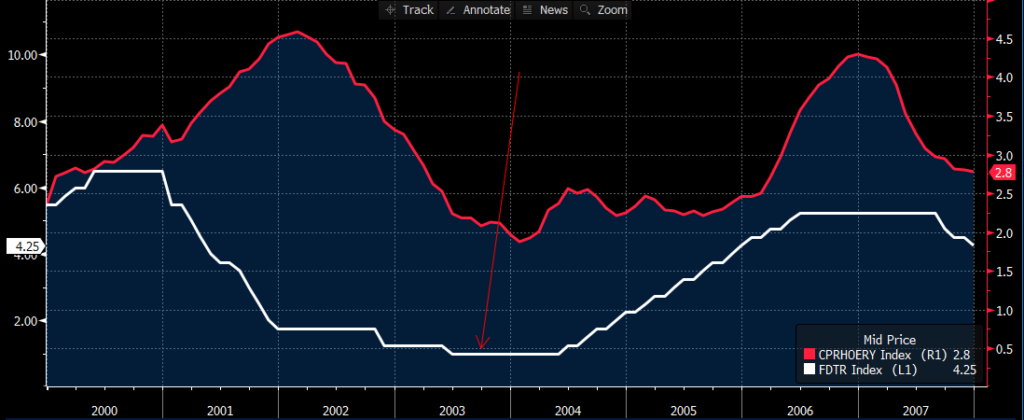
Source: Bloomberg
Basically, if the BLS had been using CPI with house prices included (below, red line) – rather than OER (below, blue line) – CPI would’ve been 6-8% p.a. over a large portion of 2000-2006, and the Fed would’ve been aggressively hiking in 2002 rather than cutting and waiting until late 2004 to slowly hike rates until 2006.
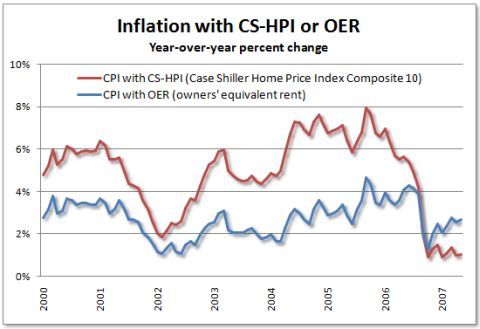
Source: SeekingAlpha.com
OER and Inflation in 2021
Because central banks slashed cash rates in 2020 and longer-term government bond yields fell (until recently), OER has dropped significantly (red line) due to lower mortgage costs offsetting any price increases.
In the meantime, US house prices have risen 10% (blue).
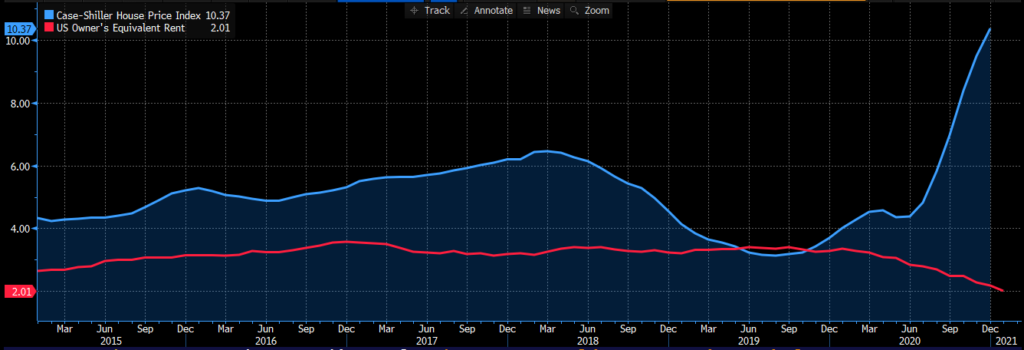
Source: Bloomberg
It’s quite likely that soaring home prices in the USA will end up being a negative or flat contribution to inflation statistics, which will be the opposite of reality where housing related costs are soaring through higher house prices.
Flow-on Effects
One of the big contributors to US house price rises in the 2005-2007 period was increased usage of Home Equity Line of Credit (HELOC) loans, basically where a person re-mortgaged their house as a line of credit for spending. This works while home prices rise and causes a lot of issues when they fall.
According to Rocket Mortgage (NYSE: RKT) in their latest quarterly earnings call, refinancing is occurring at the fastest rate ever.
Also, labour mobility is harder than ever as if you need to move to find a new job, you’re likely a renter. Most people don’t buy as soon as they move into an area, they rent until the move becomes permanent. This disproportionately affects blue collar workers (less ability to WFH) as well as Generation Z or Millennials relative to Baby Boomers.
The confluence of all these factors will cause quite the conundrum to the Federal Reserve who will be looking at inflation data to estimate monetary policy efficacy. By not seeing the increase in house inflation, likely they will keep monetary policy ultra-accommodative and fall behind the curve when the offset of lower mortgage rates is more than offset by the higher house prices – much like what occurred in 2001-2006 period, where the Fed was slow to recognise the housing market bubble.
The worst part, the Gen Z or Millennials most affected by this decrease in affordability will need to save more and spend less in order to eventually save the required deposit amount for a home purchase.
This drop in spending will not be offset by the retiring Baby Boomer generation, who are looking for less speculative investments and rotating assets with increasing velocity into bonds, amortising annuities and cash holdings.
The answer will be to hike interest rates, probably at the wrong time.
Forward Looking Indicators
2021 is already looking to be a big year for US house prices through data available for January, and forward-looking indicators signal that this should continue.
Emerging from the COVID19 pandemic of 2020 – yet still ongoing – can you guess how much volume of US housing stock is available?
There’s barely any at all.
There are less than 500k homes for sale across the entire nation, a country with over 139.7million housing units (source: Statista).
This equates to 0.30% of total stock up for sale, or 1 in 279 homes – very low.
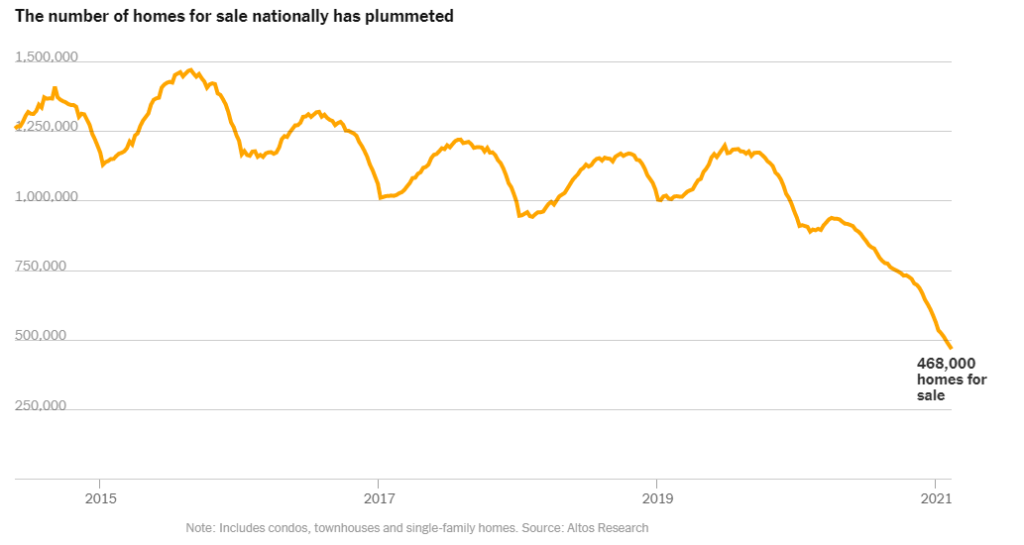
Source: Altos Research
And this isn’t because of any state or regional phenomenon; this is consistent across most of the US’ largest cities.
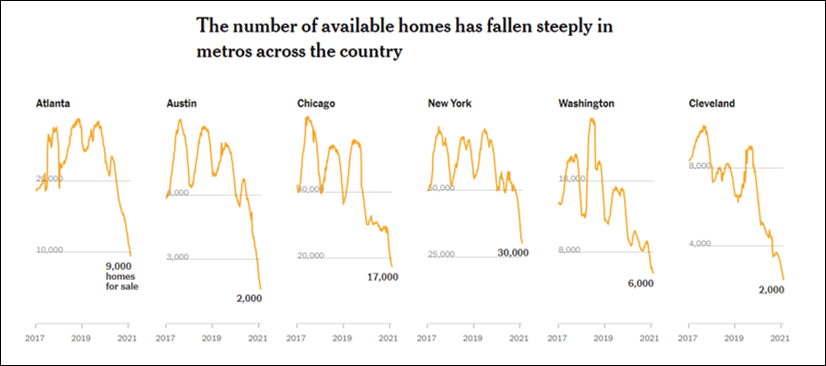
Source: Altos Research
Everyone is buying at once.
The USA has experienced extraordinary demand for property both in part due to security and safety concerns from COVID19 but also increased ability to work from home.
This is why US house prices are roofing, while rents remain flat or down.
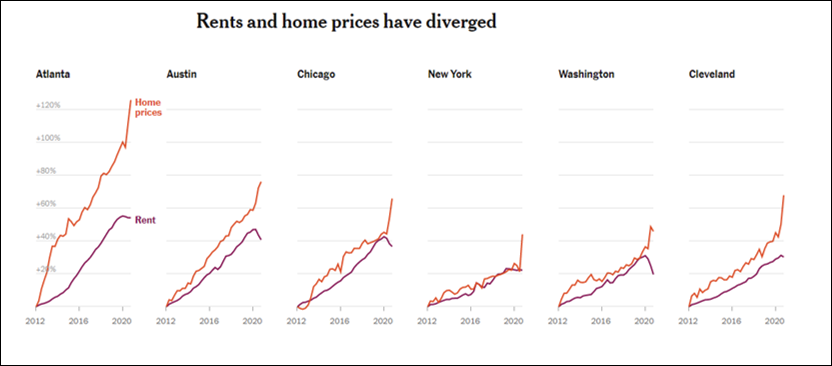
Source: New York Times
Closing Remarks
House price appreciation is an increase in costs of living, as people will need to pay a proportional increase of their take-home pay to afford a house, a basic need for most people.
However, as we can glean from per my backtest for 2000-2006, it is unlikely this increase in living expenses will show up again in US inflation figures, and the Federal Reserve will not hike rates because they won’t see inflation.
They’ll likely see disinflation because of lower to flat rents, where borrowing costs are lower.
This CPI will also translate to lower wage increases for those on collective bargaining agreements and an erosion of US households purchasing power, which is ~60% of national GDP.
In aggregate, I can foresee this causing a stagnation of the US economy where the growth rebound post-COVID is short lived because consumers will see a net reduction in their propensity to consume, where they need to save incrementally more and more in order to afford a house and the US enters another slow-growth economic phase similar to 2009-2019.
The views expressed in this article are the views of the stated author as at the date published and are subject to change based on markets and other conditions. Past performance is not a reliable indicator of future performance. Mason Stevens is only providing general advice in providing this information. You should consider this information, along with all your other investments and strategies when assessing the appropriateness of the information to your individual circumstances. Mason Stevens and its associates and their respective directors and other staff each declare that they may hold interests in securities and/or earn fees or other benefits from transactions arising as a result of information contained in this article.
