Good morning and a happy winter solstice to all, where the hiemal solstice marks the first day of winter as the Earth reaches its maximum tilt away from the Sun.
Our northern hemisphere neighbours are experiencing today’s summer solstice, where the Earth’s tilt is at the opposite maxima.
As such, they are (generally) experiencing warmer weather as summer begins, and as their economies increase vaccination rates, and economic and international borders reopen (somewhat).
With this comes increased economic activity from households, businesses and governments, and the potentially higher prices if supply doesn’t reopen quick enough.
These higher prices from goods and services are known as inflation and are primarily passed through to financial markets through bond yields, which move higher as increased compensation for inflation risks.
This forms the basis for writing today’s note:
How high can bond yields move before eliciting an equity market reaction?
Historical Context
We started having this conversation in February, where it seemed the last 9 years of interest rate cuts hit their nadir, outside of a brief 1.25 year period where the Fed attempted to raise rates and ultimately capitulated and then cut again, where global central banks would finally be moving into a hiking cycle rather than an easing (cutting) cycle.
However, bond yields are actually lower now than they were in February, where the bond market sell-off of November 2020 to February 2021 was based on perceptions of future central bank monetary policy, where the current market pricing is more reflective of explicit central bank policy.
This is why the bond market sell-off of February lost momentum in the past four months, and yields are lower now than they were then, with US 10y treasuries peaking at 1.74% (blue line) and trading down to 1.53% at time of writing.
Furthermore, this has allowed equities to grind higher, with the S&P 500 trading up from 4019 to 4221 as well (red line).
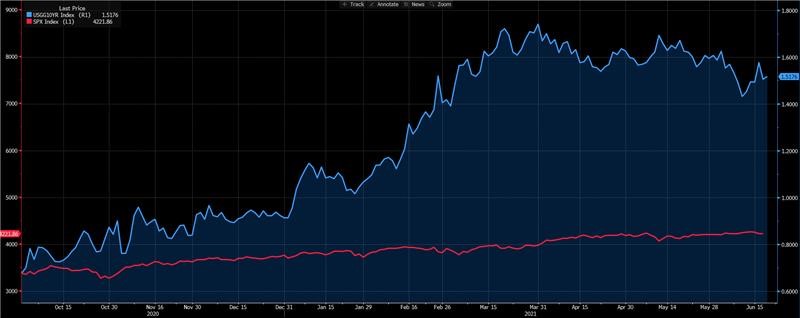
Source: Bloomberg
Discounting Cash Flows
If you’re wondering why equity valuations are dependent upon bond yields, the answer lies within a valuation technique known as Discounted Cash Flows (DCF).
I recently listened to a conversation between former US Federal Reserve researcher Danielle DiMartino Booth and former Federal Reserve Dallas Branch Governor Richard Fisher on this self-same topic.
Di Martino Booth asked Fisher how high interest rates could move, before the stock market would gag and valuations would decline.
Fisher answered, retelling a conversation with the Fed Governor of the time, Ben Bernanke, where Bernanke stated:
“Richard, the math is simple. You do what we did [lowering interest rates] and an investor can discount the present value of future cash flows literally to infinity, that’s the maths”.
As for the maths itself, it’s not too complicated where:
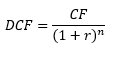
Where
CF = Cash Flow
r = the interest rate
n = the number of periods into the future
The “r” component is the key here as it represents the discounting rate that typically represents a firm’s weighted average cost of capital (WACC), where for large corporations they typically issue bonds as funding and the interest rate of these bonds (the borrowing cost) is the key feature in the denominator of the equation.
Hence, if interest rates (r) are low or even 0%, then the valuation will move higher towards infinity (where the CF >0).
And therefore, when interest rates move higher in a short period, this can have a dramatic effect on a company’s equity valuation.
Whereas if it happens more slowly, there’s less effect as the valuation could be balanced by a commensurate increase in revenue (CF).
Slowly Rising Interest Rates
Central bankers know this, as it was obviously a discussion item amongst the US Federal Reserve and a component of their monetary policy back in 2008-2010, and probably is at present as well.
It is why central bankers have established calendar-based guidance for monetary policy, a form of forward guidance where monetary policy expectations were guided years into the future, to ameliorate the potential for the market to factor in higher interest rates in the short term, and see equity valuations tumble, unnerving the economic rebound and recovery.
The RBA was quite explicit with this, where they enacted “yield curve control”, pegging our three-year government bond at the same level as the Overnight Cash Rate (OCR) at 0.25% and then 0.1%, where the peg is currently residing.
This is also why central banks are slowly and carefully guiding the market away from calendar-based guidance, back to data-based guidance, utilising inflation and employment data sets.
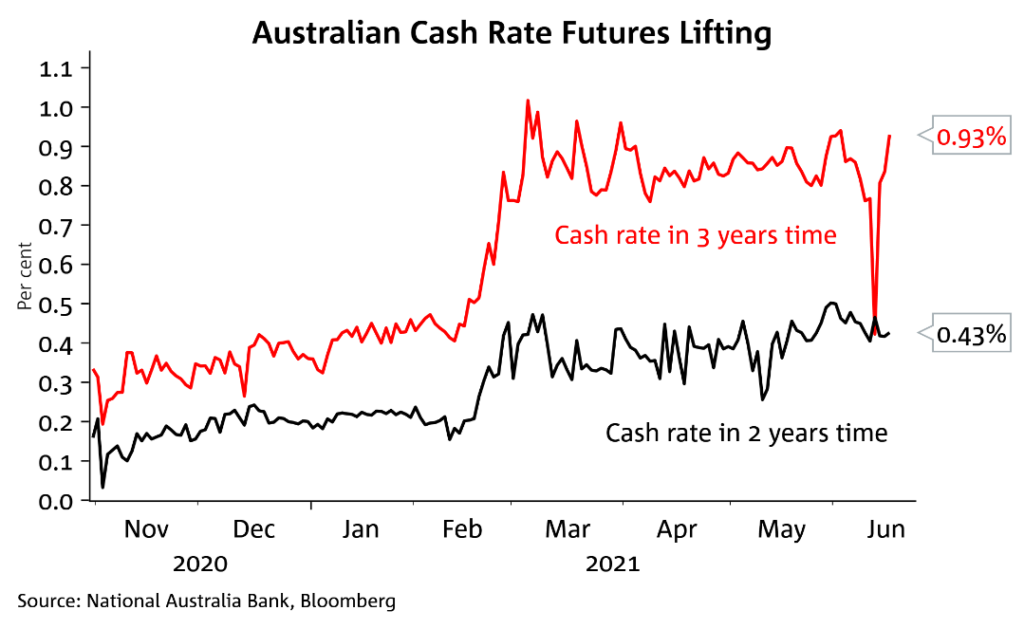
This allows the market to forecast the likelihood of interest rate hikes in the near future (near 0% chance), where across any developed market it’s unlikely we see rate hikes in 2021 or most of 2022, where markets are looking at 2023 as the time for lift off.
Timing Markets
With all of this as background, it’s quite interesting to assess whether higher bond yields will see lower equity valuations where there’s ultimately two scenarios at play:
#1 Bond yields meander higher over the next two to three years as markets price in higher cash rates as central banks slowly and gradually “normalise” policy back to what we would consider lower levels. Under this scenario it’s less likely that there’s a “taper tantrum” event and equity markets sell off.
#2 Bond yields sharply move higher over a few weeks or months, rather than years, and equity valuations tumble as the “r” component of the DCF equation is reset over less “n” periods. This would more likely elicit an equity market sell-off and some panic selling, something central banks are looking to avoid.
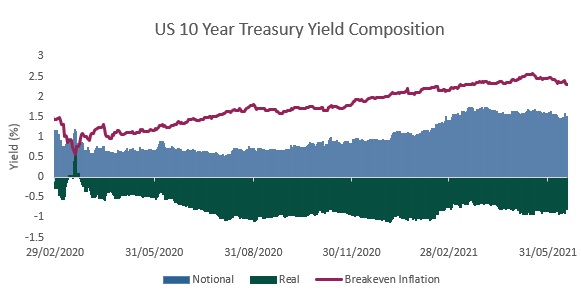
Source: Mason Stevens
At the moment, I lean more to the first camp, where central bank and government policy remains the primary driver of financial markets, as there’s less market price discovery, and we have more of a planned economy, with policy set down from government agencies.
This falls in line with our 2021 multi-asset allocation framework that we published in the above hyperlinked note in December 2020, where our outlook remains relevant, 7 months later.
The views expressed in this article are the views of the stated author as at the date published and are subject to change based on markets and other conditions. Past performance is not a reliable indicator of future performance. Mason Stevens is only providing general advice in providing this information. You should consider this information, along with all your other investments and strategies when assessing the appropriateness of the information to your individual circumstances. Mason Stevens and its associates and their respective directors and other staff each declare that they may hold interests in securities and/or earn fees or other benefits from transactions arising as a result of information contained in this article.
