
Bond markets are not meant to be interesting.
Bond markets are where governments and corporates can raise money via borrowing, to finance their operations, projects and objectives.
Bond markets are meant to be orderly and stable, a place of mathematics where practitioners can show off their statistical prowess by constructing yield curves and profiting from lending their capital at attractive rates.
Last week, and really, for the last 2-3 months, bond markets have become interesting (again).
What we saw was a global bond market sell-off, where fixed rate bonds (those most sensitive to interest rate movements) sold-off to reflect a higher projected inflation risk.
Economic overheating
Higher inflation has been the known unknown outcome of the COVID-19 pandemic, where the quantum of fiscal and central bank relief and stimulus efforts is a balancing act between the decreased consumer and investment activity within the economy.
Too much stimulus and the gap between potential and actual economic output – the output gap – closes, and the economy runs hot.
Too little stimulus and the gap is evident, and a protracted sub-economic recovery persists, similar to the last decade where the world posted the worst post-recession growth numbers since WWII.
This unknown quantum of inflation is what the market is trying to factor into bond prices, where and when economies are overheating, so that as bond investors, they can be compensated with higher yields and incomes to reflect this higher inflation.
What happened?
Due to the inverse relationship between bond prices and yields, when yields moved higher, bond prices declined (the sell-off).
However, not all fixed-rate bonds sold-off.
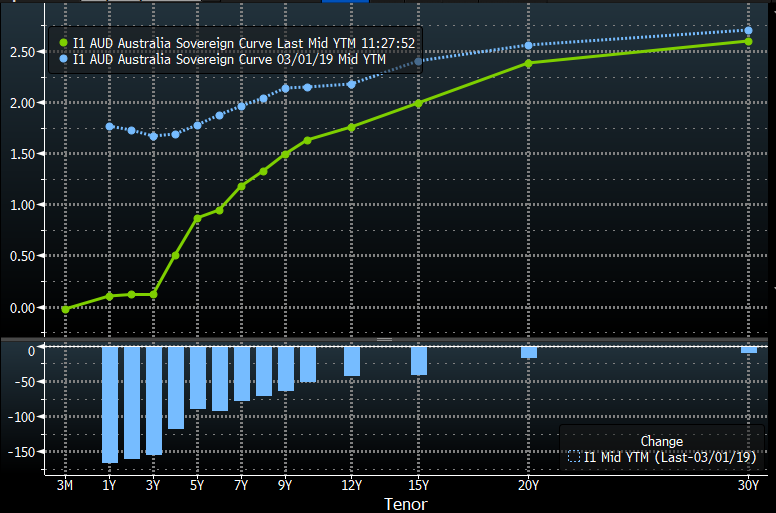
In particular to Australia, it was 4y and longer bonds that sold-off (green line: yields higher), 1-3y bonds barely budged.
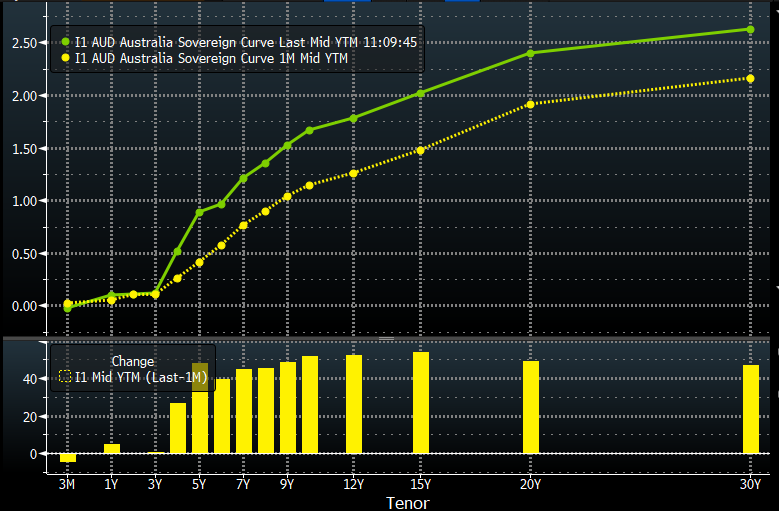
There are two reasons for this:
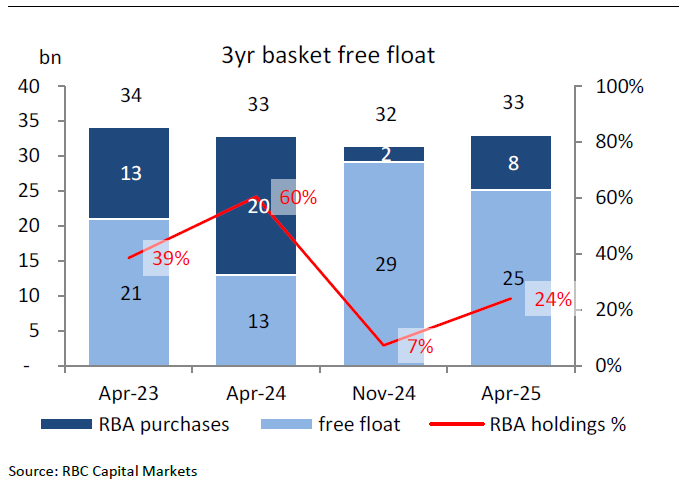
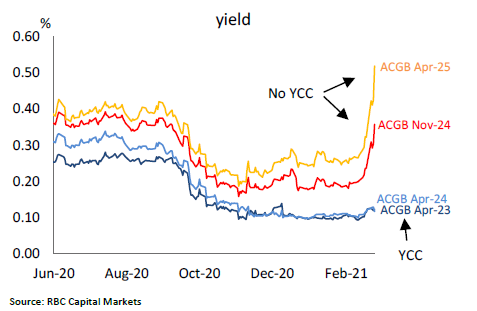
1. Our RBA is defending their Yield Curve Control (YCC) target of 0.10%, by buying Australian government bonds in secondary markets.
In fact, they’ve bought so many of these ~3y bonds that they own 39% of the 34bln of April 2023 govies, and 60% of the 33bln of April 2024 govies. As the RBA now owns more than half of the free-floating April 2024 government bonds on issue, price discovery is more limited, and there’s less free-float available for trading.
2. Bond markets are pricing in economic overheating in the second half of 2024 calendar year.
This can be seen in the differential between April and November 2024 government bonds, where there is over 0.30% difference between the two bond lines.
Implicitly from current bond market pricing, RBA’s implied cash rate is 0.83% for February 2024 – an implied hike of 73bp.
A pragmatic approach
How far do yields rise? This is the trillion-dollar question.
I’ve looked at this from several different angles. As a bond investor, I don’t want to be caught out by a continued bond bear market.
The easiest ways to avoid this are to:
- Decrease exposure to longer-duration fixed-rate bonds.
- Buy Floating Rate Note (FRNs) that reset periodically and benefit from higher cash rates and interest rate benchmarks.
- Buy Inflation-Linked Bonds (ILBs) that reset periodically as a margin above the Consumer Price Index (CPI), where the coupon is adjusted higher to reflect higher realised inflation.
But also, there’s money to be made in assessing the direction where markets will go from here!
Rationale #1 – pre-COVID vs post-COVID
Firstly, yields are moving back to where they were 12-24 months ago.
Logically, if we’re going to experience pre-COVID levels of growth and inflation, then we should expect a pre-COVID level of interest rates.
In the below chart, the blue line is Australian government bond yields on 1 March 2019 versus 1 March 2022 in green.
Note that while yields have risen, they still aren’t back at pre-COVID levels.
Intuitively, there is room for them to move higher should inflation really eventuate.
Statistically, I’d wager bond traders are 50:50 on inflation hitting pre-COVID levels, which is why yields are below March 2019 levels.
Rationale #2 – Inflation pricing
One way that bond traders evaluate inflation expectations is the differential between nominal fixed-rate bonds and inflation-linked bonds.
This differential is called “break-even inflation.”
For example:
Australian 10y nominal bond = 1.61%
Australian 10y inflation-linked bond = -0.28%
Break-even 10y inflation = 1.61 – (-0.28)
= 1.89%.
In the US, this 10y breakeven calculation is 2.15%, very high.
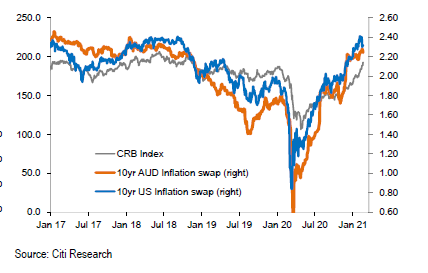
Tracking these inflation expectations versus the Thomson Reuters Commodity Index (CRB) shows that inflation expectations have moved higher, quicker than commodity prices have increased, and are starting to top out.
This means that artificial inflation proxies such as breakeven inflation projections have moved higher than real price gauges of inflation, where spot commodity prices reflect economic realities rather than projections
Rationale #3 – Risk-on sentiment and economic reopening
Commodity prices can be used in assessing inflation due to a strong link between trade volumes, economic growth and inflation.
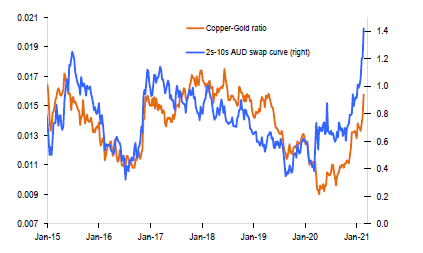
One lens we can use is the differential between Australian 2y and 10y government bonds (2s10 spread) and the ratio of copper and gold prices.
Right now, this ratio is showing us that yield curves have steepened a lot more than copper prices relative to gold, and either copper needs to increase quickly (or gold sell-off), or that this move is overdone, and yields should fall.
Rationale #4 – Sell-offs present a buying opportunity
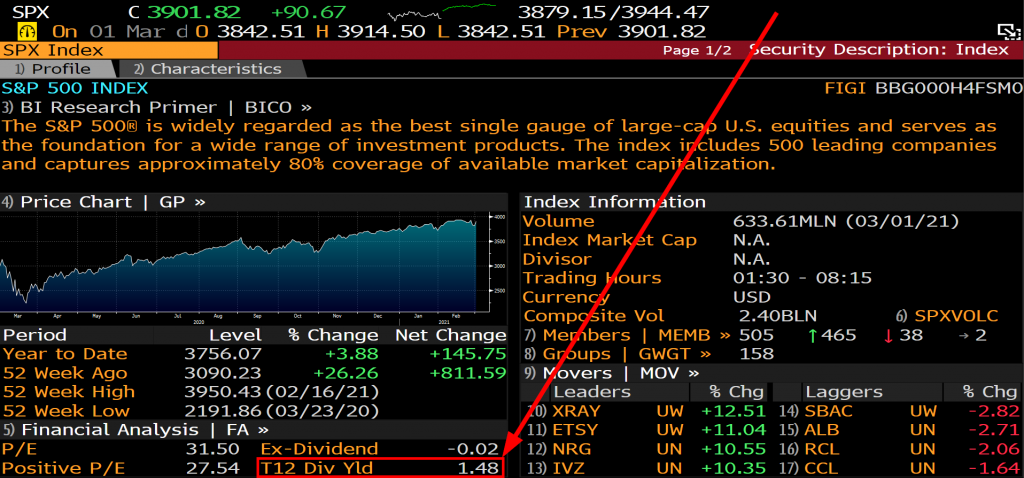
It is interesting that a wave of buying occurred when US 10y bonds hit 1.52%.
Interesting because this was the trailing dividend yield of the S&P 500 index – which has since dropped slightly to 1.48%, seen in the below graphic.
This could mean that a significant volume of asset managers and traders saw US 10y bonds as a buying opportunity at 1.52%, to achieve a level of income equal to the US equity market, with less capital at risk.
Furthermore, there may also be a large cohort of asset managers that believe the current higher than 2% inflation pricing is too high, and that likely inflation is lower than this level (I’m in this camp).
Therefore, they’d be looking at the sell-off as an opportunity for future capital gains, when bonds rally (yields fall) to reflect this economic reality.
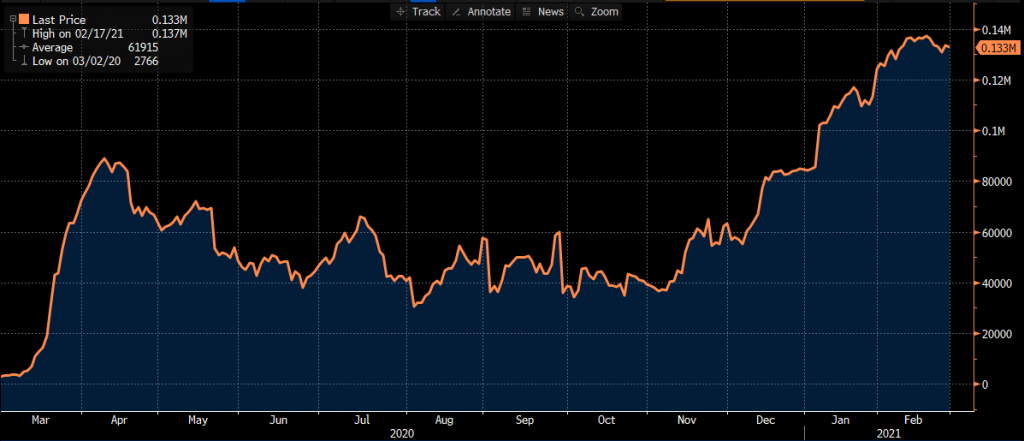
In terms of dry powder, there’s more than enough surplus cash available to buy government bonds at higher yields.
Below we chart surplus cash deposited with the RBA from our nations deposit taking institutions, reaching 133bln AUD last week.
This is an expanse of cash that can be easily mobilised to buy bonds, where advantageous to do so.
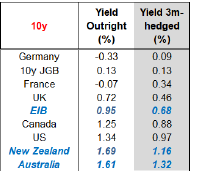
From a foreign investors’ perspective, Australian 10s at 1.61% are attractive compared to global sovereign bonds of the same tenor.
The below table calculates both the hedged and unhedged yield that a Japanese (JPY) based investor would receive in buying global government bonds.
Australia sticks out on both bases, and is also true for EUR based investors as well
Closing remarks
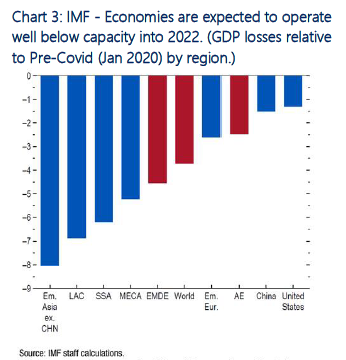
It’s curious that we’ve gone from pricing a defined output gap, where global economic output tracks well below its potential.
This made intuitive sense, as COVID-19 had reduced demand, where supply was at similar levels.
Reduced demand and constant supply? Output gap!
And it’s very difficult for the economy to overheat when there’s slack in the labour force, and in economic output.
Hardly the image of an overheating economy.
This is why it’s interesting that, all of a sudden, the market is factoring in economic overheating, with the US 1.9 trillion dollar fiscal relief plan being the influence.
Will the full 1.9 trillion USD be passed?
If so, will all of it be spent?
How much will be saved?
How much will go into balance sheet repair and debt repayment?
What will the multiplier effect be? Will the debt be productivity enhancing (positive multiplier) or unproductive (negative multiplier).
Data that addresses these questions will be in high regard in these coming months and years, as bond prices reflect the evolving narrative and economic reality.
The views expressed in this article are the views of the stated author as at the date published and are subject to change based on markets and other conditions. Past performance is not a reliable indicator of future performance. Mason Stevens is only providing general advice in providing this information. You should consider this information, along with all your other investments and strategies when assessing the appropriateness of the information to your individual circumstances. Mason Stevens and its associates and their respective directors and other staff each declare that they may hold interests in securities and/or earn fees or other benefits from transactions arising as a result of information contained in this article.
