
There has been a lot of hype over the last few weeks regarding the sell-off in sovereign bond yields, most of it fixated on longer-duration government issued fixed-rate bonds of maturities 7+ years from now (2028 or later).
Due to the sheer overwhelming demand for information on this topic, we’re writing this note to demystify some concerns arising from the sell-off.
Today we’ll discuss why these government fixed-rate bonds of longer tenor have sold off, the impacts on investor portfolios that own bonds, and the flow-on effects to equity markets.
Reasons for the sell-off
If you’re after a comprehensive review of the recent-sell off, please see my note from last Wednesday that covers the essentials in more detail, a 6 minute read.
A quick summary – as nations and economies start to re-open and economic activity picks up, the market has begun factoring in higher probability of rising goods and services pricing.
Basically, factoring in higher inflation.
This is also a relative concept, as “higher inflation” might sound scary, but the market is predicting around 1.7-2.2% inflation per annum, over the next 10-year period.
Literally, around ~2% inflation per annum, not higher.
From a central bank point of view, this is still below target inflation of 2-3%, and certainly not run-away “hyperinflation” that has crippled nations such as Weimar Germany, Zimbabwe, Venezuela, Turkey, Argentina and others over the last 100 years.
If the rise in interest rates is based on only moderate inflation, then we don’t want to get too far ahead of ourselves assuming markets are going to collapse or that inflation will drastically erode returns. This is what happened in the 1970s when the Baby Boomer generation entered the workforce and aggregate demand grew quicker than supply for a multi-year period, which saw former US Federal Reserve Chair Volcker hike rates into the stratosphere.
Relative interest rates
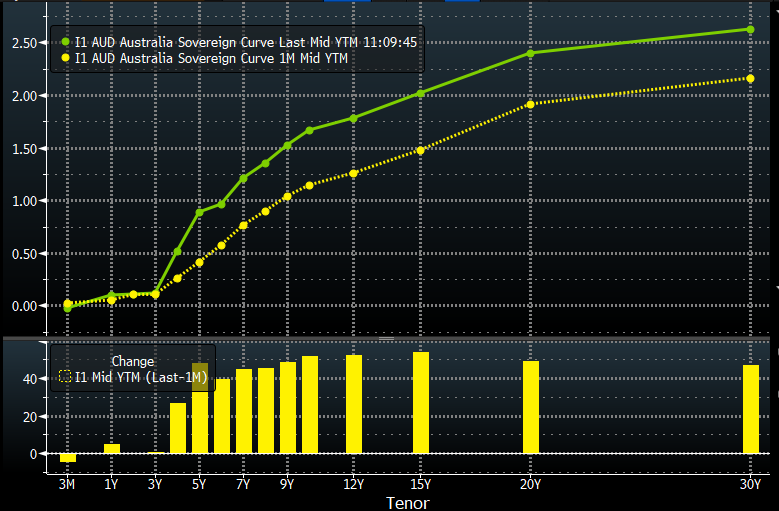
In the below chart, the green line is the current Australian Commonwealth government bond yield curve, and the yellow is where they were one month ago.
Relatively, this is how far interest rates have moved. Notice that it’s only ~5 years or longer bonds that are rising?
This is because #1 central banks are anchoring these shorter-term yields at low levels as a form of forward guidance to provide stability and certainty to financial markets, and #2 the higher expected inflation – yet still modest – isn’t forecast to occur until 2024 or 2025!
Yes, literally not even this year!
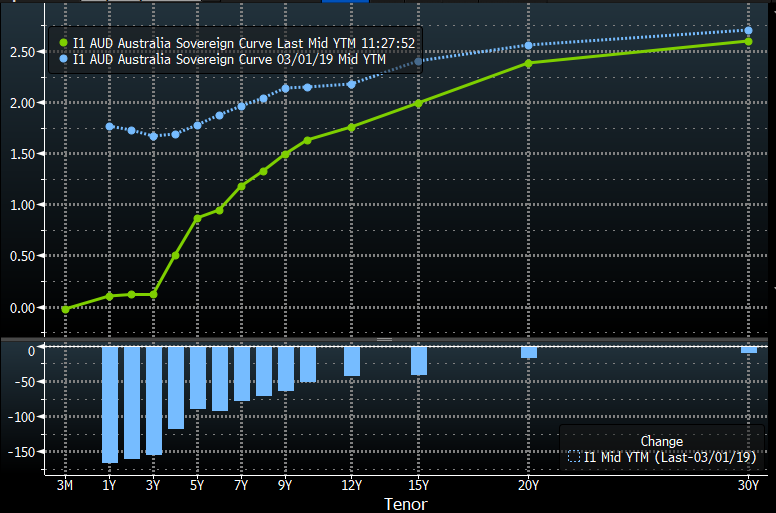
Putting this into perspective, our current Commonwealth bond yields are still BELOW where they were in March 2019 (blue line).
Longer tenor bonds
It should be well-noted that this backup in yields (bond prices down, yields up) is associated with growth and higher consumer demand, but only affecting longer duration bonds.
The fact is that the majority of portfolios held on the Mason Stevens platform do not own bonds of such long fixed-rate interest rate exposure, because of the inherent interest rate risks associated with such long-term assets.
Investors that hold such assets are usually invested in benchmark/passive government bond funds that replicate the Ausbond bond index, such as Vanguard Australian Government Bond Index Fund (ASX:VGB), or Betashares Australian Government Bond ETF (ASX: AGVT), which have modified duration (measuring interest rate duration) of 7+ years.
These funds or similar portfolios may have experienced some volatility recently, sure, but this isn’t most investors on our platform.
It is also worth mentioning that this IR exposure is more associated with passive fund managers, as active managers are able to hedge their interest rate risk through interest rate futures, swaps and options.
Different rate types
Not all bonds are made equal, either.
Bonds are essentially tradeable loans between those with capital and those seeking capital, where a contract is entered for a specific:
- Term (the maturity of the loan)
- Number of coupon payments
- Yield of the coupon payment
- Type of coupon payment (floating rate, fixed rate, inflation linked rate)
The type of coupon matters greatly to this sell-off, as (longer duration) fixed-rate securities were affected disproportionally more than floating rate or inflation linked securities.
The reason for this is simple – floating rate and inflation linked notes have coupons that reset frequently, often quarterly or semi-annually, limiting exposure to market interest rates to just these 3-6 month periods.
In fact, they are quite likely to rally during these periods as the security will pay a higher coupon at the next periodic reset date, making it more valuable.
If you think about this logically, a fixed rate bond has one single interest rate exposure for the life of the bond. If market interest rates rise, this affects the relative value of the bond. But if interest rates rise, the bond with regular resets built into the coupon schedule will pay out higher and higher rates until maturity.
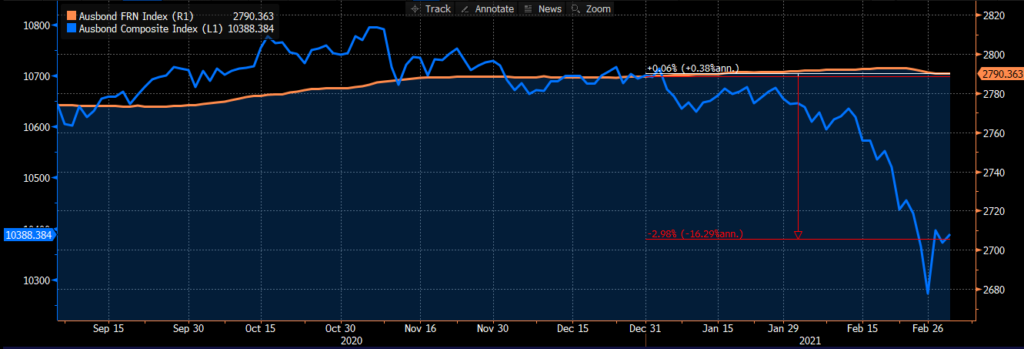
In the below chart, I compare the Ausbond FRN index (floating rate) in orange versus Ausbond Composite Index (mainly fixed-rate) performance since 31-December-2020 to present.
The FRN index is +0.38% while the Composite index is -2.98%.
To re-emphasise this point, the higher forecast interest rates will see a higher yield to maturity (YTM) or yield to call (YTC) of recently issued securities that utilise floating rates, such as CBAPJ or MQGPE hybrids.
Equity valuations
Bond markets are usually the leading indicator for inflationary pressures, due to the size and liquidity of the market, and also because of the transparent pricing of inflation-linked bonds.
Equity markets are usually second to react, where different companies and sectors are affected differently.
Increasing interest rates affect longer-duration equities more than shorter-duration equities, similarly to bonds.
Higher-duration equity sounds like an oxymoron, as equities are perpetual instruments with no contractual maturity date, but it isn’t.
This term refers equities that are expected to deliver a higher proportion of future cashflows in the distant future. In contrast, shorter-duration equities are expected to deliver a higher proportion of their cashflows in the near future.
Zenith Investment Partners put out a great note on the subject back in 2019, well worth a read.
In general, “growth” stocks have longer durations than “value” stocks and will benefit from lower interest rates as they have over the last decade but will be under pressure in a rising interest rate environment, relative to value stocks.
We’ve already begun to see this sector rotation where the NASDAQ – a largely growth index, underperforms the S&P500 or other global markets on days where bonds sell off (interest rates higher).
Factors affecting future interest rates
As mentioned, interest rates and bond yields are transparent and immediate sources of price discovery and tools for measuring inflationary expectations, because economic activity is causally related to borrowing costs.
The market has begun pricing in higher interest rates than 2020 as economies re-open, but they are still lower than 2019 interest rates.
This is very telling, making it obvious that the higher inflation being touted in the media is to grab headlines and website traffic, with little substance.
The structural factors that are anchoring interest rates at historically low levels still persist and haven’t been addressed.
Factors such as:
- Increasing global labour supply
- Demographics where a large population (Baby Boomers) are retiring and rotating from growth/equity exposure to more defensive assets such as cash/bonds
- Low productivity growth
- Low wage growth
- High government indebtedness
- High household indebtedness
For these reasons, the sell-off in fixed-rate government bonds of tenors ~4-5 years or more is likely to be viewed as an opportunity for certain fund managers representing a growing population of retirees, as they rotate from capital growth investments to capital stable investments, with reduced propensity to consume and invest.
The views expressed in this article are the views of the stated author as at the date published and are subject to change based on markets and other conditions. Past performance is not a reliable indicator of future performance. Mason Stevens is only providing general advice in providing this information. You should consider this information, along with all your other investments and strategies when assessing the appropriateness of the information to your individual circumstances. Mason Stevens and its associates and their respective directors and other staff each declare that they may hold interests in securities and/or earn fees or other benefits from transactions arising as a result of information contained in this article.
