Investing is always interesting, as most of the time we’re trying to make capital gains in understanding how the world works, and in particular, the way that global capital markets work.
The essence of equity investing is to buy companies that are undervalued, and to grow your capital base as the company becomes more richly valued, trending towards its intrinsic worth.
Whereas for more defensive investments, say fixed income for example, you’re looking for a certain level of income and trying to minimax your possible losses.
Sidebar: if you’re interested by the world minimax, it’s a subset of “decision theory” and used within micro-economics and algorithmic programming.
Regardless of the asset class that you’re investing into, you should be forming a cohesive investment thesis to allow a certain level of conviction.
Depending upon the strength of your conviction, you can then size the investment appropriately.
In today’s summary, I wish to share my own investment process with the hope it may assist with your own methodology.
The Five Criteria of any Investment
In my decade plus of investing I’ve quite easily read hundreds of books on investing, whilst putting in tens of thousands of hours of screen time, making thousands upon thousands of investment decisions, having managed billions of dollars of capital.
I still remember my largest trade to date, selling 1.2 billion AUD/USD in a 1-week FX swap.
In fixed income it’d have to be one of the many times I’ve bought/sold 100 million of government bonds, or more than 1 billion (might have been ~1.2 billion) AUD if we include repurchase agreements too.
This might sound large depending on your background in financial markets, but I can guarantee there’ll be people reading this working for large banks or central banks that have done much larger trades!
Regardless of if the transaction is 10k or 1 billion dollars, your rationale is what forms your psychological base, your investment thesis, that lets you size your investment.
The decision matrix that I follow uses the following five criteria, which I first heard about from HSBC’s head of spot FX trading, Brent Donnelly, in his AM/FX research series.
You can also read about it in his book: The Art of Currency Trading.
The criteria are as follows:
- Fundamentals
- Technicals
- Sentiment and Positioning
- Correlation
- Catalyst
If you find an investment that ticks all five criteria off – a “five-star trade” – then you can have a higher level of conviction in your stance, over a thesis that has less stars.
Hence, when our team are looking for value in global capital markets, we’re trying to identify opportunities that align with as many of these criteria as possible, as part of our own rationale.
Fundamentals
At its heart, all investment analysis is undertaken to identify under-priced assets.
Fundamental analysis uses public data such as credit ratings, economic output, consumer prices (and inflation), corporate profitability, earnings growth, debt serviceability etc to screen for opportunities.
The fundamentals differ situation to situation and asset class to asset class, but they’re usually easily found in qualitative and quantitative data sets that define the structural underpins of an idea.
Technicals
Technical analysis focuses on price and volume data.
Most often, it’s thought of as forms of charting to scrutinise the intersection of supply and demand to form prices, and how the price of a security trades within a market.
It can be used to generate short or long term buy or sell signals, based on the patterns and levels of price.
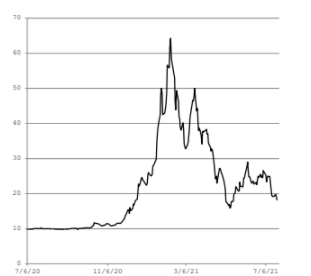
For example, if we review the below chart of Danimer Scientific Inc (NYSE: DNMR), many of us might look at this and think different things.
You could look and thinking that the price at $17/share is well above the $10/share level in November last year.
But you could also go one step further and project that the 600% rally was overdone, and that the chart is forming a “head and shoulders” pattern, only to head lower from here.
As a slightly harder example, looking at the chart of Denbury Inc (NYSE: DEN), a hydrocarbon capture stock that ticks a LOT of ESG boxes and has skyrocketed in popularity as ESG really takes off these last 12 months; you’ve got a share price that trade up from $20/share to $80, only to re-trace back to $66 and then go sideways the past few weeks.
Technical analysis tries to evaluate if the price action of the security will form a base and move higher (that’s my take), or if the upwards trend has inflected and the price will move down from here.
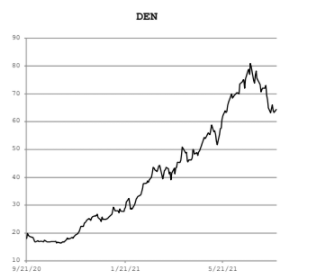
Due to the subjectivity of technical analysis, I don’t believe we can fully grasp the picture of supply and demand just from charting alone, but that this can be a powerful tool when utilised with the other 4 criteria.
Sentiment and Positioning
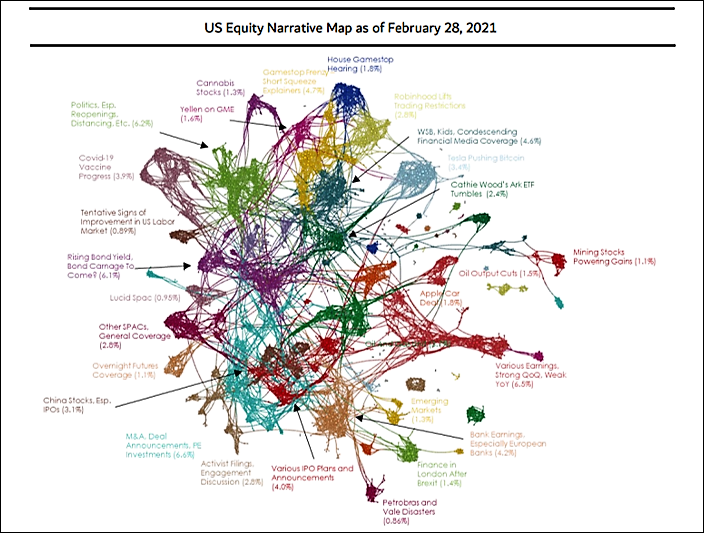
This criteria is growing in popularity due to the proliferation of “big data” and natural language processing, that is allowing us to better understand market sentiment.
I wrote about one method of this recently in our WFH article, detailing how we can use k-means clustering to analyse media sentiment around topics (such as Work from Home).

The above might be gobbledygook because it wasn’t labelled, but if we did, it might look something like this: (you may need to zoom in)
Max also shared a variation of this type of analysis in his Friday article, using Google Trends data plotted against 10-year US government bond yields:
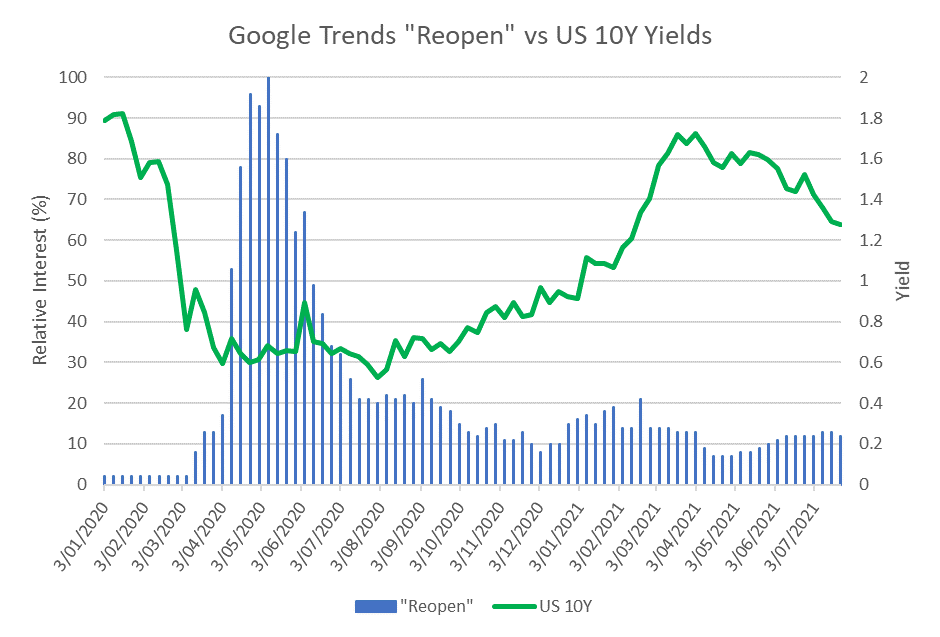
The above two examples are more depicting “sentiment” rather than “positioning”, where there is an obvious disconnect that investors could SAY they want to invest in XYZ security, but don’t actually do it.
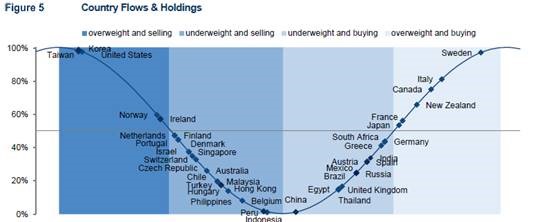
Hence, we also like to utilise global custody bank data, that shows fund flows and positioning preferences.
For example; State Street Bank and Trust (NYSE: STT) has over 40.3 trillion USD in assets under custody, where their custody data is a great cross-sectional proxy for investment holdings.
Take for example the below chart from April 2021, where they map the stock and flow of global equity markets, across their client base.
If I was to use this as part of my investment criteria, we’d be looking for equity markets that are currently underweight and have positive flows, that ALSO tick the other boxes of the four criteria.
Correlation
This is the trickiest of the five points, as it requires a decent level of financial market data (such as a Factset, Bloomberg, Reuters etc) and some statistical know-how such as using MATLAB or eViews.
Thankfully I’ve got a bit of both, so I have a forward-looking view about asset class correlations, which are useful when designing multi-asset portfolios.
For most investors, it may be less used, because it can often lead to discarding profitable investments, because they reduce portfolio utility.
We won’t spend as much time on this criterium, but we often graph the outputs to show the relationship between two assets or asset classes.
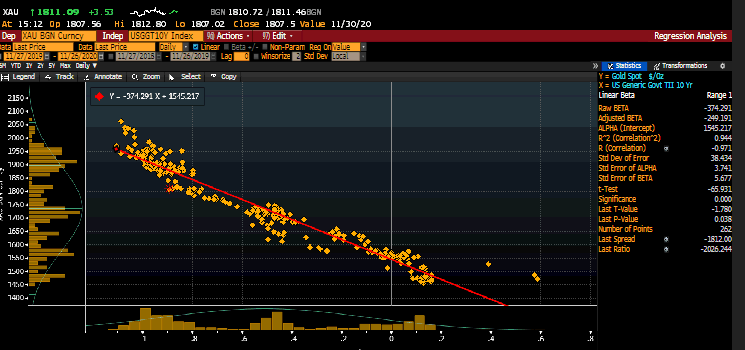
In the below graph I compare the relationship between gold prices and inflation-linked bonds:
Or this chart comparing sectoral correlation between Australian corporate bonds:
Catalyst
This is what I consider to be the most important criteria, as it seeks to answer WHY the investment is going to make money.
A catalyst could be a new law being passed, a terrorist event, a High Court decision, a change in taxation, a speech by a world leader, a company earnings announcement… there are a multitude of catalysts that can cause asset prices to move for an investment to profit, but there often needs to be a catalyst.
I consider it to be the most important criteria because it nullifies the asinine “gold equities have never been this cheap” type of comment, where something being fundamentally cheap does NOT mean the asset will gain in value.
Likewise, “equity markets are overvalued” does not mean equity markets will sell-off.
In fact it’s usually the opposite, where securities exhibit momentum, which is a powerful factor used in portfolio design.
The proverbial “the trend is your friend”.
It was one of the lessons I learnt during the GFC when USD/CAD approached parity and I made a bet that it would hit parity and reverse…which it didn’t, where I lost 8% as USD/CAD dropped down to ~91-92c, before exploding higher.
When thinking of this, I remember the phrase attributed to John Maynard Keynes:
“markets can remain irrational longer than you can remain solvent”.
Which is why we need a catalyst to be present for our investment ideas to work!
Closing Remarks
It’s been my experience that investments that tick 3-5 of the criteria are my best investments, as they combine multiple indicators that provide greater certainty of success, where a 5-Star Trade is usually a “no brainer” because there’s next to no reason NOT to make the investment, allowing us to have a higher level of conviction.
The views expressed in this article are the views of the stated author as at the date published and are subject to change based on markets and other conditions. Past performance is not a reliable indicator of future performance. Mason Stevens is only providing general advice in providing this information. You should consider this information, along with all your other investments and strategies when assessing the appropriateness of the information to your individual circumstances. Mason Stevens and its associates and their respective directors and other staff each declare that they may hold interests in securities and/or earn fees or other benefits from transactions arising as a result of information contained in this article.
