
It might sound like we’re talking about radio channels and frequencies, but the title of today’s note is referring to different equity and bond market allocations, where investors face a trade off between investing in developed markets (DM), emerging markets (EM) and frontier markets (FM).
The quandary is the function of different structural and long-term forces, where EM and FM have higher expected return values assigned to their equity markets, because they are relatively less affected by the malaise of developed markets – what we call the 3 D’s:
- Increasing public and private indebtedness
- Aging demographics
- Deflation and disinflation of technology and how that anchors real (ex-ante) wages
By Definition
There are several approaches to assessing whether a nation’s equity market and thus its bond market is considered DM, EM or FM, with the most popular remaining the MSCI classification standard.
In order to classify the various market, MSCI uses a framework that scores
- Economic development
- Size and liquidity of the market
- Market access: openness to foreign ownership, operational efficiency, ease of inflows/outflows, availability of different instruments
This is the basis for then categorising the market into four distinct categories – DM, EM, FM and “standalone” referring to singular markets with limited investability (trust me, it’s a word) with virtually no access to foreign investors.
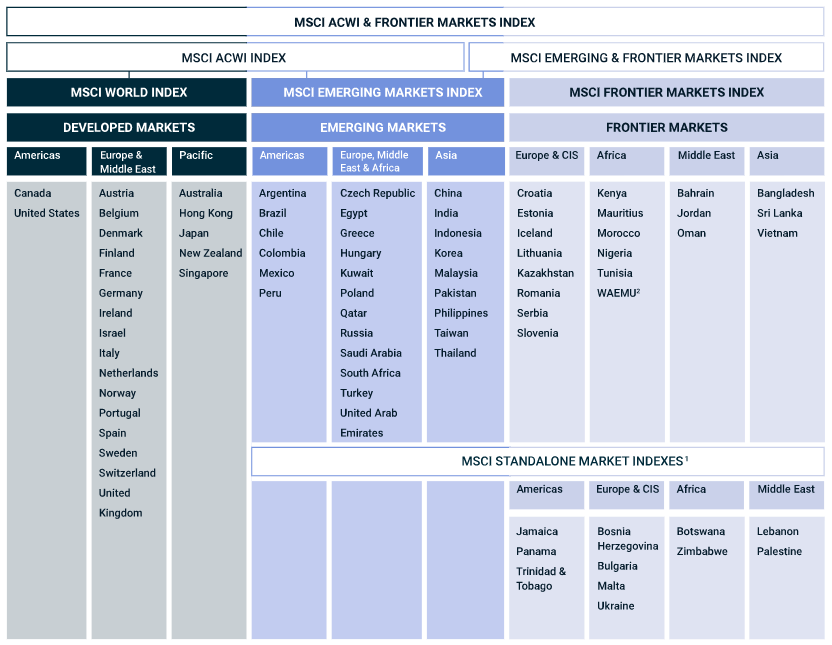
Source: MSCI
It should be intuitive that:
- The most developed nations are amongst the DM category (Australia, USA, France, Germany, Japan etc),
- The emerging nations that are growing but not quite considered developed (Brazil, Hungary, China, South Korea) or were once developed but experienced turmoil that saw their ranking slip (Argentina, Russia) are in the EM category,
- And the least developed but still accessible for an investment are considered FM.
Structural Tailwinds
Both EM and FM alike both have structural tailwinds that provide a compelling investment rationale, akin to the same way an investment manager will utilise micro-small cap equity investments to achieve above average growth by purchasing companies at the start of the growth phase; the same way global asset allocators can allocate to EM and FM, investing in countries that are growing above average with a greater breadth of exposure than compared to purchasing individual stocks with idiosyncratic risks.
These structural tailwinds are as mentioned in our opening preamble, lower public and private indebtedness, a younger workforce with more prime working years ahead of themselves, where inflows of capital will allow them to build new systems and operational infrastructure, bypassing the legacy systems and architecture that riddle DM economics and financial markets.
In(d)ebtedness
EM and FM nations have lower sovereign (public) debt ratios than compared to DM nations, where most DM nations have debt/GDP of >100%.
However, across EM nations that ratio is less than 60%, and has declined slightly this year due to a rebound in economic activity, particularly in commodities markets.
This debt/GDP ratio is important as above 90-100%, the debt burden has a deleterious impact on long-term growth.
Even above 70-80%, the ECB, BIS and IMF have cited that nation’s should start to enact prudential fiscal policy to curtail the growing impact of government debt on an economy.
Chart 1 – EM National Debt/GDP Ratios
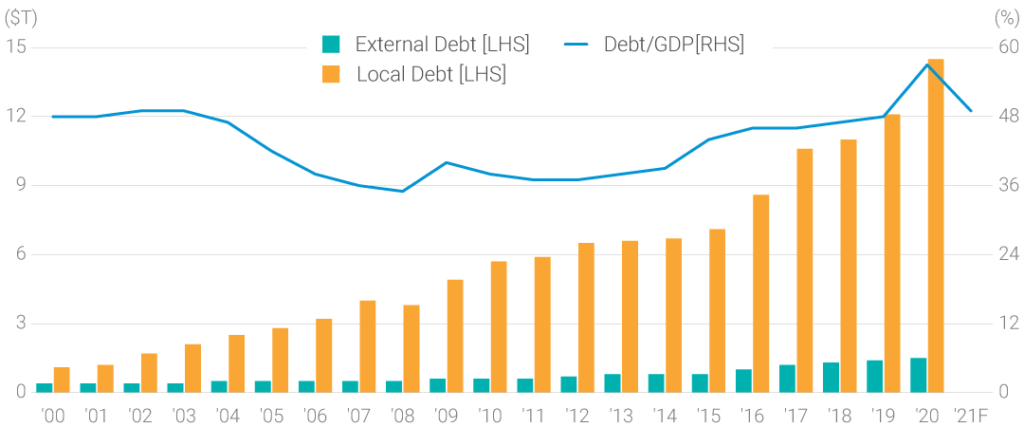
Source: Lazard, Haver Analytics, JP Morgan
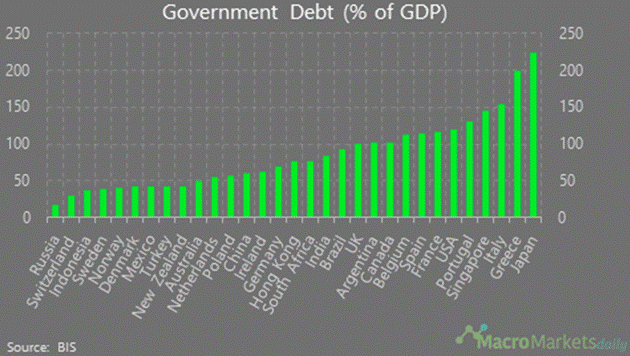
It’s also important to note that not all DM economies have this high a debt-GDP ratio, where in Australia we’re below the 60% threshold at the government level, for now, but closing fast.
Chart 2 – OECD Debt/GDP Ratios
(D)emographics
Between now and 2050, the world’s population is projected to grow to ~9.3 billion people from ~7.9 billion at present (Source: Fitch Ratings))
EM and FM economies are forecast to account for 99% of this 1.4 billion.
If productively employed, a growing (and younger) labour force contributes to the accumulation of wealth and in turn, should require greater amounts of investment in capital, land, services etc.
In an ideal world, a virtuous cycle is created, where capital and labour expand while productivity improves, all leading to higher economic growth.
However, there is a certain phase of this cycle that needs to be respected, as the catalyst for a potential stock market growth cycle.
Prior to urbanisation, low-income EM and FM nations are largely based on agriculture and minerals exports and tend to have higher fertility and mortality rates associated with the lower levels of GDP per capita.
As urbanisation and industrialisation occurs – a natural progression of an economy with a relatively inexpensive labour force that can be utilised for manufacturing – fertility rates slow and begin to drop, leading to their labour force growing quickly relative to younger dependents (think of the “Baby Boom”), allowing for faster economic growth and wealth accumulation.
Mortality rates than fall as income rises where the number of dependents eventually grows relative to the labour force and dependency ratios increase, requiring the diminishing workforce to support more non-workers >> a situation we’re in at present in Australia and most DM economies.
Chart 3 – Dependency Ratios by Region
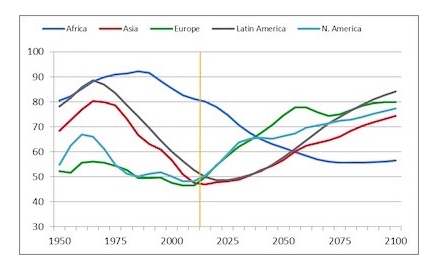
Source: Fitch Ratings
Weaker growth and increased dependency ratios begin a vicious cycle, where lower fertility rates beget lower growth prospects yet again, which is why we’re continually seeing supply chains seek lower cost nations to build factories, over the last century.
Technology (D)eflation
Technological invention, upgrades and adaptation is the undisputed driver of productivity in the global economy.
Looking at the US data provided by the Bureau of Labor Statistics, technology assets have a compounded annual growth rate (CAGR) over the pats 20 years of 6.6% for information processing, 5.8% for computers, 9.6% for communications equipment and 8.9% for software.
Whereas structure’s (infrastructure) CAGR was 1.2%, land 1.3%, rental property 0.5%, non-technology assets 3.0%.
And this is even after the massive adaptation of new tech during 1990 to 2007, where computers related equipment enhanced productivity by 28.1% p.a. and software by 13.9% p.a.
Knowing this provides us one of the two elements that set the scene for profound growth from EM, because of technology.
The other is the deflation of the price of technology, despite the increasing productivity it provides.
Technology can be found to increasingly become cheaper and cheaper each year, based on either a lower outright price per unit (i.e., computers becoming cheaper) or relatively cheaper where they provide more productivity for the same price (computer price stays the same, but has more processing capacity, better resolution, more memory etc).
Chart 4 – Annual Headline US CPI (blue) versus US technology CPI (red)
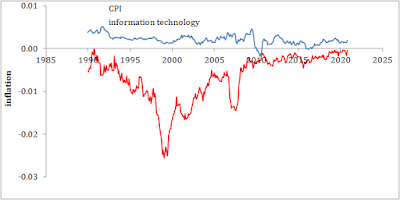
Source: Economics as Classical Mechanics
As such, EM and FM economics are not burdened by the legacy systems of DM economies and have the ability to use these new(ish) technologies in their economies, at decreasing prices, accessing economic growth without the same levels of investment that were required by DM nations to research, develop and built out the same technology in their own economies.
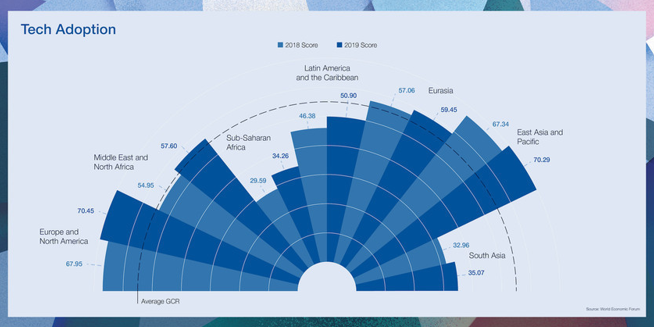
Source: World Economic Forum
The Near and Long-term Investment Thesis
The investment thesis is thus, EM and FM economies have relatively higher expected returned ahead of them because of these tailwinds, where structurally they should out-perform over the long-term.
Over the short to medium term, however, EM and FM have some headwinds because of their relatively lower vaccination rates where DM nations have vaccinated their populations up to 20x faster, than less developed economies.
We highlight this statistic with the following chart, where developed nations across the USA, UK, EU are generally further ahead vaccinating compared to EM and FM nations such as Hungary, India, Indonesia, Malaysia, Mexico etc.
Chart 5 – National Vaccination Rates, as at 20-September-2021
Source: Bloomberg
This amongst other factors such as turmoil in China, has seen EM specifically underperform in the short-term, where investors (such as us) will be looking at this as a buying opportunity.
Investable Options
There are many options available to a nimble investor using Mason Stevens investment platform and our APL, ranging from the passive index replication style to the more active.
iShares MSCI EM ETF (ASX: IEM) is the largest, with more FUM than the Vanguard FTSE EM ETF (ASX: VGE).
Within the ETF domain but more active there’s Fidelity Global EM Fund (ASX:FEMX), which is a more aggressive choice, also the VanEck MSCI Multifactor EM ETF (ASX: EMKT), which tilts towards value, momentum, quality and smaller companies, which can be utilised for a different style of EM return.
As for FM markets, the main vehicle we’ve seen investors use has been the iShares MSCI Frontier and Select EM ETF (NYSE: FM), which has close to $500m USD of FUM, and a weighted average P/E of 17.25, invested across Vietnam, Kuwait, Morocco, Kenya, Nigeria, Romania, etc.
Closing Remarks
It’s definitely hard to argue against the long-term merits of both an EM and FM allocation, though we’re keenly aware of the current timing of the market, and the volatility and disruption that COVID is causing in some of these economies, and potential issues and fallout associated with fragility in China.
However, in writing this note we hope that all investors understand the structural tailwind, where we can seek better levels to enter a new investment.
The views expressed in this article are the views of the stated author as at the date published and are subject to change based on markets and other conditions. Past performance is not a reliable indicator of future performance. Mason Stevens is only providing general advice in providing this information. You should consider this information, along with all your other investments and strategies when assessing the appropriateness of the information to your individual circumstances. Mason Stevens and its associates and their respective directors and other staff each declare that they may hold interests in securities and/or earn fees or other benefits from transactions arising as a result of information contained in this article.
