The recent selloff in some global equity markets has been sudden, as equity markets began to price in reduced monetary policy support from global central banks.
This selloff should be viewed in context that while the price declines of the past two months were swift and negative, it comes after a very strong CY2021, and the recent declines haven’t (as of yet) wiped out last year’s gains.
To illustrate this, we share the 3-month gain/loss of regional equity exchanges, where the far-right column shows the change in value, excluding any income/dividends paid.
Chart 1: Comparison of Regional Equity Indices
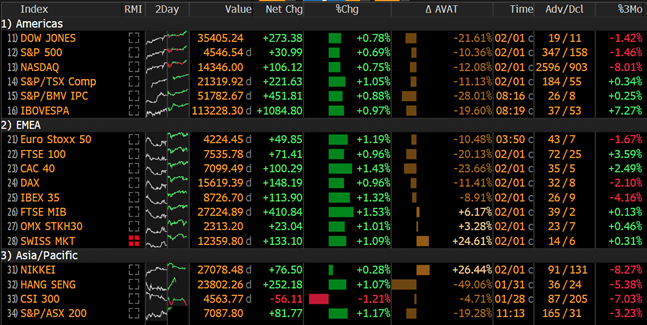
Source: Bloomberg, as at 2/2/22
The nuance that gets lost when viewing the headline numbers is the bifurcation within the indices themselves, where some areas of the Nasdaq, for example, see smaller and less profitable, or unprofitable tech down 50 or more percent, while some companies are relatively unscathed.
Hence, the index can be down 20% on average, because some companies have been relatively unaffected while some have been smashed.
For example, companies such as Robinhood (Nasdaq: HOOD) and Peloton (Nasdaq: PTON).
Robinhood was at $42/share on 30-Sep and now at $14.65 (closing price 1-Feb), whereas Peloton’s share price was $87.05 on 30-Sep and now at $28.02.
Respectively, this is a decline in value of 65% and 68% in the interim period.
Chart 2: Share Price History of HOOD and PTON
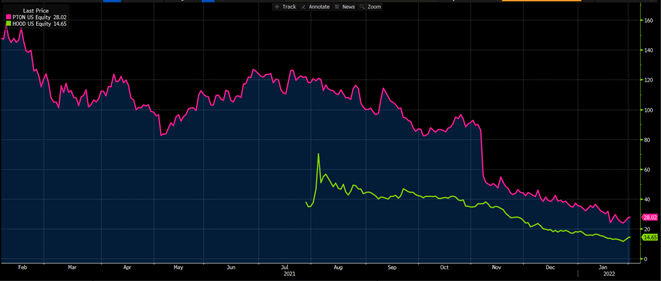
Source: Bloomberg, as at 2/2/22
Where the Money Has Gone To
The question therein is that if global share prices have declined because of investment outflows and lower valuations, then where has the money gone to?
The answer is long, but that global asset allocators have sold US tech to buy energy, sold US equities to buy European equities, and sold equities in general to buy fixed income.
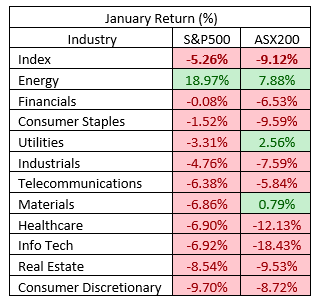
Selling Tech to Buy Energy
This strategy makes sense for investors seeking to maintain their US equity exposure by allocating from what was (until recently) an area of high growth and buoyant share prices and valuations, and allocating to energy which has been benefitted from higher domestic and international inflation, and less capital investment in non-green energy infrastructure.
As Mike pointed out yesterday, energy-related equities have been a strong area of outperformance during the sell-off, and also represented an investment in companies with less lofty valuations (lower P/E ratios).
Source: Bloomberg, Mason Stevens
Mike’s note highlighted the relatively outperformance of BHP and RIO as a way to articulate this investment thematic, where I had used the idea of the BetaShares Global Agriculture ETF (ASX: FOOD) as my proxy in model portfolios, benefitting from its rise from $6.75 to $7.42/share (+9.92%).
Chart 3: Price History of FOOD ETF
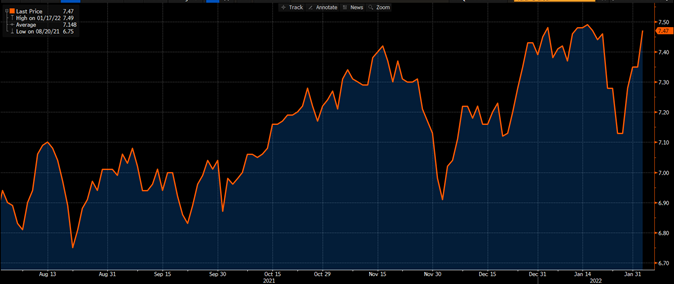
Source: Bloomberg, 2/2/22
The US to EU/UK Rotation
What made the recent sell-off a little different was the repatriation from European investors selling down a portion of their USD assets to buy EUR.
We naturally saw this happening in real-time through the EUR/USD and GBP/USD exchange rates, where EUR and GBP rallied against the USD, generally during European market hours.
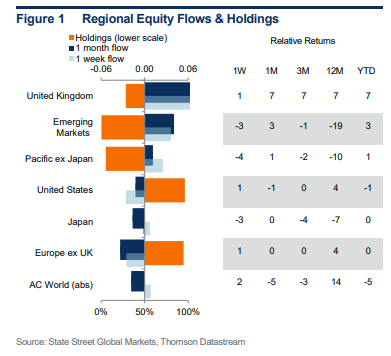
We received confirmation of this at the end of January where custody data became available, showing there was a rotation from US and emerging market equities into UK and European equities.
Interestingly, the European buying seemed to happen in the first half of January, whereas the UK buying was in the last week of January.
Chart 4: State Street Custody Flow Data from 27-Jan to 31-Jan (inclusive)
Equities into Fixed Income Rotation
Asset allocators selling growth assets such as equities to buy defensive assets such as government bonds is a well-established reaction function of investors, most often summarised as risk-on/risk-off (RORO) macro-economic investing.
The recent equity market sell-off has been no exception, though the context is a little different this time given the sell-off was due to a sell-off in fixed income assets – something we covered in Monday’s note.
What’s interesting about this was that because the equity market correction had gone so far, this started to feedback into bond yields which were seen as too high, where bonds where then bought and yields moved back lower.
This makes the whole ecosystem very complex but ostensibly:
Inflation data higher >> central banks perceived to become more hawkish >> higher 1-10y bond yields >> equities selloff >> growth expectations decrease >> 11-30y bond yields decrease >> 5-10y bond yields decrease to maintain yield curve structures (gradient/term structure) >> equities have a small rally.
While this doesn’t arrest the move higher in bond yields and likely means that we’re going to continue to experience more volatility in the weeks and months to come, it does contain the equity market sell-off in the near term and allows investors to focus on the current outstanding reporting season with company earnings outperforming.
Closing Remarks
As we’ve mentioned in our 2022 Outlook as well as a plethora of other missives since then, this year is likely to be another tug-of-war between the memes of POLICY and FUNDAMENTALS.
Where we’re all aware fundamentals are bad and many financial markets (on average) are overvalued, and they’ve been overvalued for years already because POLICY from central banks and federal governments has been supportive in both stock and flow of money.
Even while central banks are tightening policy in nominal terms, they are behind the market’s inflation curve, where policy is expected to remain loose and expansionary for years to come.
Chart 5: US Cash Rate Forecasts (green) vs Inflation Expectations (red), bottom panel is differential
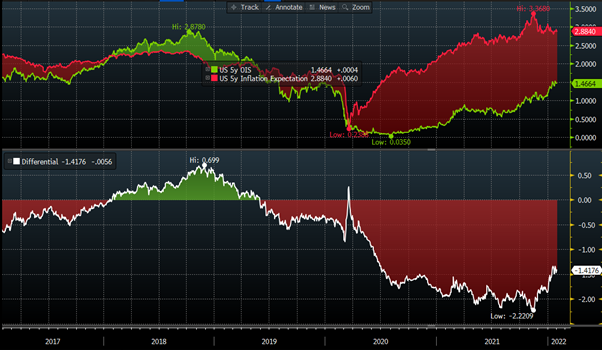
Source: Bloomberg, as at 2/2/22
This presents a quandary, because if the Fed and other central banks are credible in their mission to return policy back to neutral, then the current path of rate hikes is not aggressive enough and we need higher cash rates or smaller central bank balance sheets to be forecast, OR, inflation expectations need to decline significantly.
Either way, it’s likely we experience continued volatility as this transpires.
The views expressed in this article are the views of the stated author as at the date published and are subject to change based on markets and other conditions. Past performance is not a reliable indicator of future performance. Mason Stevens is only providing general advice in providing this information. You should consider this information, along with all your other investments and strategies when assessing the appropriateness of the information to your individual circumstances. Mason Stevens and its associates and their respective directors and other staff each declare that they may hold interests in securities and/or earn fees or other benefits from transactions arising as a result of information contained in this article.
