
Good morning and welcome back to the Mason Stevens morning notes series.
Today is the first of some 200 daily letters we’ll write over the coming year to provide insights that are informative, actionable and of interest financially.
Since we left off in our last note on 10 Dec, quite a bit has changed with a large number of equity markets well off their 2021 highs, bond yields higher, inflation data higher and central banks either tightening monetary conditions or flagging they will do so in the coming days/weeks/months.
For today’s note, we thought it would be best to bring everyone up to date into what has happened in the interim period between 10 Dec and today, to bypass the noise and clarify what’s important.
COVID-19 Update
Omicron was already affecting financial markets before we left off, though there has been a surge in global case numbers from ~600k/day in early December to >4mln/day and now back to 2.4mln/day.
And if we’re honest, we also know that the 2.4mln/day isn’t factoring in a lot of cases because people are getting tested less for varying reasons.
Chart 1: Daily Global COVID Cases
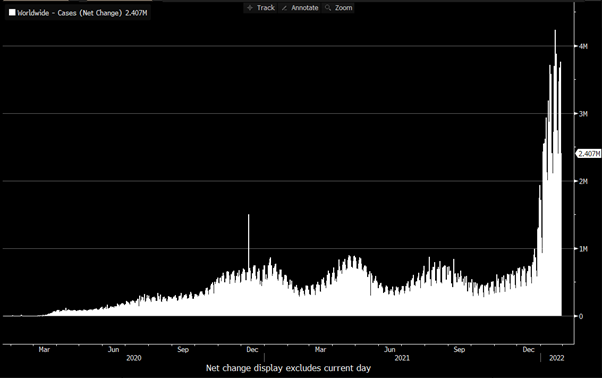
Source: Bloomberg, as at 28/1/2022
So far we’ve experienced a new COVID “wave” every ~6 months, where the sheer number of COVID cases due to the Omicron variant are likely to see a new variant as well – it might already be in the world.
Markets are viewing this two different ways:
Firstly, the next variant could be incredibly transmissible (like Omicron) but less severe >> likely a positive for risk asset prices as a signal of less impact to come.
Secondly, the next variant could be less transmissible (than Omicron) but more severe (like Delta), or just as transmissible and more severe…. >> both these scenarios will likely be immediately negative for risk assets.
While news of this kind emerges, we expect there to be a certain trepidation and fragility to markets, who are aware COVID’s impact is not over yet.
Inflation Data
Inflation – the periodic price increase in a basket of goods and services – has continued to rise over the past two months, though the rate of change is slowing, showing signs that we may have or are nearing peak inflation.
This isn’t to say that inflation will not remain elevated, globally, but that global inflation may trend down from 5% y/y to a lower figure.
It’s also likely that global inflation remains above the trend level of the 2010s, due to the constant secular disruption of supply-chain reconstruction, and the impact that’ll have on various areas of the real economy.
Chart 2: PriceStats Global YoY Inflation
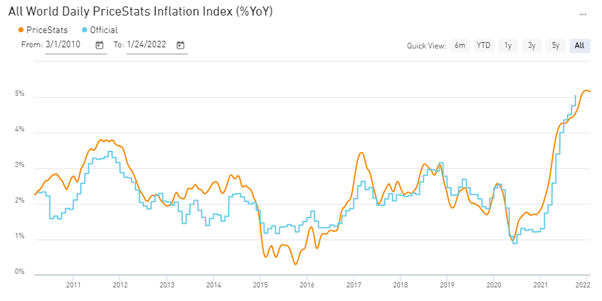
Source: PriceStats, State Street, data up to 24-Jan-2022
It’s important to note, also, that Australian inflation as measured by CPI is a different story to US, UK, NZ, Canada, and other inflation rates where Australian inflation is within the RBA’s target band, whereas inflation is above central bank target bands for these other nations.
Australian trimmed-mean CPI is currently 2.6% y/y (as at 31-Dec), the highest level since 2014, and above the RBA’s November 2021 “upside scenario” forecasts, inferring that there’s likely a forthcoming revision to their growth, inflation, and cash rate forecasts, in upcoming weeks.
Central Bank Reaction Functions
CY2022 is likely to be an ongoing evolution of central bank policy responses to ongoing inflationary pressure and other economic data, something we set out in greater detail in our 2022 outlook.
Because economic indicators have been gaining positive momentum in the past 6 months, central banks have – on average – brought forward their policy guidance.
In some cases, such as Canada, NZ, the UK, central banks have immediately tapered their asset purchase programs and some banks have already hiked interest rates.
The US is a contrast to this, though while they are in the process of tapering, they are still in that process and not expected to hike interest rates until March, despite having a national inflation rate >7% y/y.
Chart 3: The USA’s Implied Overnight Cash Rate (blue)
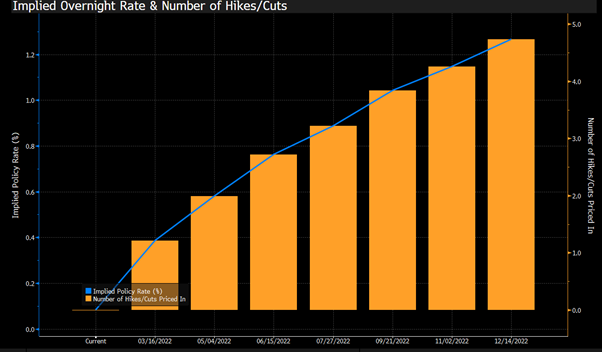
Source: Bloomberg, as at 28/1/2022
The RBA is also a contrast, where our national inflation rate is within target and at last publication, the RBA has stated 2024 was their base case to raise interest rates, and hike in 2023 in their upside scenario.
The market doesn’t believe the RBA, with hikes already forecast for this year, given economic data is well above the RBA’s targets for the upside scenario.
This has seen Australian front-end bond yields rise 40-50bp in the past three months, from the yellow line (3m ago) to the green line (today).
Chart 4: Australian Government Yield Curve today (green) vs 3 months ago (yellow)
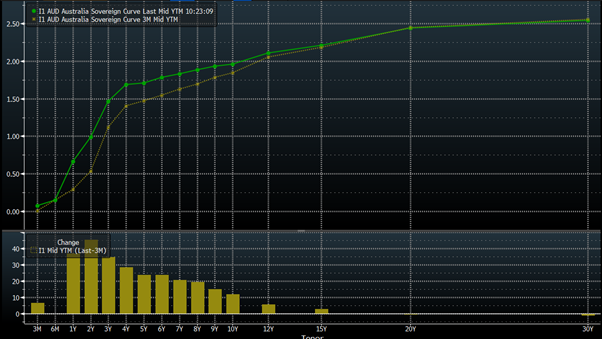
Source: Bloomberg, as at 28/01/2022
In aggregate, the withdrawal of liquidity as central balance sheets slowly contract (“quantitative tightening”) along with higher cash rates, bond yields and borrowing costs will transform the current expansionary policy environment to a more neutral environment, over time.
Real versus Nominal Tightening
Putting both the inflation dynamic and central bank reaction functions together, it’s worthwhile discussing real (ex-ante or inflation-adjusted policy) in comparison against nominal tightening of policy.
Nominal tightening is fairly simple and is the economics we all learn first and talk about most openly.
Nominal policy tightening occurs when central banks reduce financial reserves, decreasing money supply and liquidity and increase borrowing costs.
The latter is historically the focus, with the movements of the Overnight Cash Rate.
Real tightening is an assessment of nominal policy tightening with respect to inflation rates.
I.e., if the central bank hikes 1% but the inflation rate increases 1.5%, then there’s been a NOMINAL hike, but a REAL rate cut.
Putting this in perspective, in the below graphic the top panel compares US 5y interest rate expectations (green) against US 5y inflation expectations (red), currently 1.50 and 2.835% respectively.
The bottom panel compares the differential, at -1.38%.
This highlights that while the market has priced a higher cash rate, the annual inflation rate is forecast to be much higher, implying that policy is still quite expansionary, and the Fed is far from neutral.
In other words, if the Fed is true to their statements of seeking to achieve policy neutrality over the medium to long term, then either they will need to tighten policy more than currently forecast, or inflation expectations will need to decline.
Chart 5: Cash Rate Expectations vs Inflation Expectations (top panel), Differential (bottom)

Source: Bloomberg, as at 28/1/2022
Impact on Equity Markets
Over the past three months, the majority of global equity indices have returned negative, without considering any dividends and cashflows.
This has been a reaction function from the movements in bond yields – as seen in Chart 4 above.
Chart 6: Global Equity Index Returns over the past 3 months (far right column)
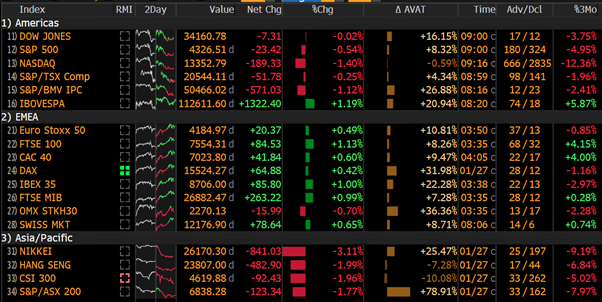
Source: Bloomberg, as at 28/01/2022
While the recent performance has been dour – most notably in the NASDAQ – it’s important to note that on a 12-month basis, performance is still positive for the majority of the world’s indices, with the exception of Brazil (IBOVESPA), Japan, China, and Hong Kong.
Chart 7: Global Equity Index Returns over the past 12 months (far right column)
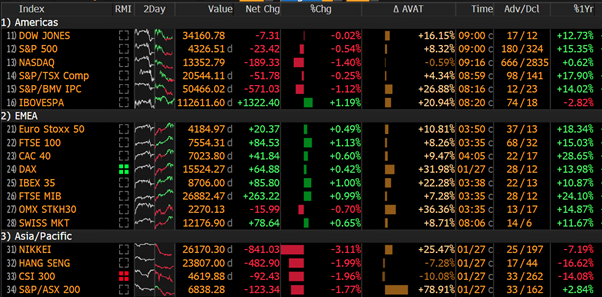
Source: Bloomberg, as at 28/01/2022
This means that while some regional indices have entered a technical “correction”, meaning they’ve lost 10% from their recent high, trailing returns are still positive and that there is still significant room for negative returns to wipe off the past year’s gains.
Also, we’ve now entered a period where the sell-off in global equities is starting to impact bond valuations, where last week’s sell-off in US equities saw inflows into government bonds (prices up, yields down), which arrested the impetus for higher bond yields, calming markets.
Outlook
One month into the new year and (thankfully) our 2022 outlook is still pertinent.
This year is most likely a continued reactionary relationship between inflation expectations and labour market statistics >> central bank reactions and their perceived reactions >> bond yields and borrowing costs >> equity market valuations.
Meanwhile, COVID-19’s impact may have a larger or smaller magnitude of impact, depending on the likelihood of a new variant emerging, and depending on its severity and transmissiveness.
So far and given the backdrop, global fiscal and monetary policy is set to become less expansionary though still expansionary, where markets are yet to forecast a return to neutral policy accommodation.
Under this regime, it seems likely that the meme of POLICY will continue to overwhelm the importance of FUNDAMENTALS.
The views expressed in this article are the views of the stated author as at the date published and are subject to change based on markets and other conditions. Past performance is not a reliable indicator of future performance. Mason Stevens is only providing general advice in providing this information. You should consider this information, along with all your other investments and strategies when assessing the appropriateness of the information to your individual circumstances. Mason Stevens and its associates and their respective directors and other staff each declare that they may hold interests in securities and/or earn fees or other benefits from transactions arising as a result of information contained in this article.
