
The month of January has now come to a close for financial markets, with the NASDAQ narrowly avoiding its worst January on record, returning -8.98%.
At the centre of all market volatility has been the repricing of sovereign yield curves, with markets reacting significantly to the expected acceleration in rate hike timelines and the earlier than expected announcement of Quantitative Tightening (QT) in the US.
These shifts in interest rate markets have been driven by the increased urgency of remediating inflationary pressures, which are not as transitory as first expected.
Chart 1: CBOE Equity Volatility Index (“VIX”)
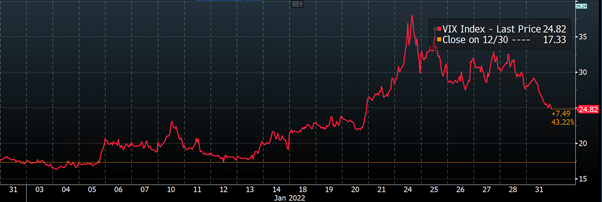
Source: Bloomberg, as at 01.02.2022
Markets are currently pricing in 5.169 rate hikes of 0.25% in the US over 2021, for an implied overnight cash rate of 1.37%, and 4.265 rate hikes of 0.25% in Australia for an implied overnight cash rate of 1.166% – a vastly different picture to what markets expected this time last year.
Though it must be noted that central banks may not actually hike as aggressively as the market suggests – given they are beholden to their own mandates and may change their current course according to updates in economic data.
The nexus of equity market selldowns has largely been a result of this rate volatility, with higher P/E stocks being hit the hardest as their future forecasted earnings have been downgraded in lieu of higher expected future interest rates.
On a fundamental basis, however, little has changed, with some stock’s outlooks improving on the back of better than expected earnings – with the majority of companies beating expectations this earnings season so far.
Some sectors less vulnerable to interest rates have actually enjoyed a positive start to the year – with value stocks rallying on the back of a factor rotation from growth, with select energy and commodity names benefitting from geopolitical tensions and increased economic activity.
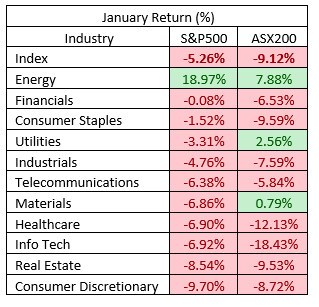
Source: Mason Stevens, Bloomberg
In yesterday’s missive, Darren focused on the negative elements of the past month, so today, we will take a look instead at some of the shining lights during the darkest month for markets since March 2020.
Value is Back in Vogue, But Will This Time Be More Permanent?
For the 2nd consecutive January, value has outperformed growth, with investors favouring near term certainty, as opposed to betting on long term growth prospects.
This time, the factor rotation may be more permanent, where it is unlikely that we get a repeat of last year’s recovery of the growth factor, given the increased certainty of rate hikes and the prospect of quantitative tightening – both of which will be thorns in the side of securities at the pointy end of the risk spectrum.
Whilst the chart below does not make for attractive viewing given market wide risk off sentiment, the factor rotation remains, and will likely continue until more certainty about interest rate and inflation outlooks are attained.
Chart 2: S&P 500 Value Index (blue) vs S&P 500 Growth Index (red)
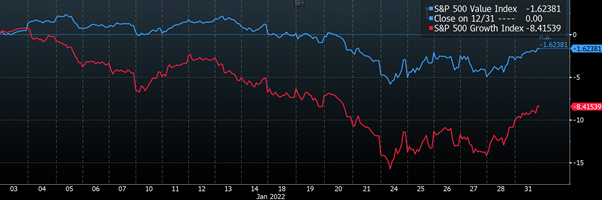
Source: Bloomberg
Should the long-term rates continue their upward trajectory, and US 10 year treasury yields break through 2% and beyond, then value stocks will continue to come into favour, as higher long term interest rates eat into the earnings of technology stocks.
However, should central banks revert to a more dovish stance, and delay the commencement of balance sheet unwinding, growth shares will likely enjoy a continuation of their market dominance.
Bringing the Energy to Market
Energy stocks have been the one bright spot in markets, with oil and natural gas prices rallying throughout the month of January.
Geopolitical tensions between Russia and Ukraine have played a large role in this price action, given Russia’s place as Europe’s No.1 oil and natural gas exporter.
Russia’s position as the primary energy provider for Europe will continue to serve as a primary point of leverage for the nation and will continue to generate volatility and uncertainty within oil and natural gas markets until a point where tensions are resolved.
The release of strategic oil reserves from both China, the US and Japan also underscore the severity of issues on the supply side, as global economic activity picks up, with many stockpiles reaching multi-year lows, further justifying the 7-year highs seen in oil prices.
Chart 3: Fuel Price History of Brent (red), WTI (blue), Nat gas (brown)
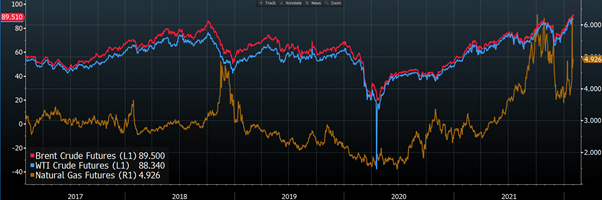
Source: Bloomberg, as at 01.02.2022
Commodities Remain Strong
Commodities tend to be one of the only assets who offer genuine protection from inflation and have been continuing to rise over the past month.
Importantly for many Australian investors, iron ore prices have rallied, on the back of increased expected demand from China, through a mixture of both lower interest rates and increased expected fiscal stimulus.
On the supply side, inclement weather in Brazil has driven supply shortages, further boosting the rally.
These changes have driven prices higher for ASX stalwarts Rio and BHP, who have been valuable gainers in a sea of red for many investors.
Chart 4: Price History of Rio Tinto (green) and BHP (red) equity
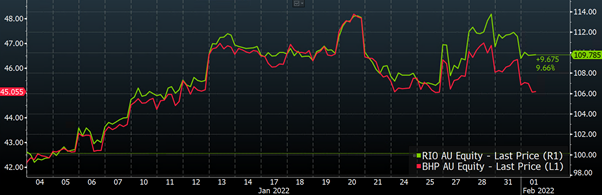
Source: Bloomberg, as at 01.02.2022
Where to Next?
Markets are currently in a time of incredible uncertainty, where investors are now unable to close their eyes and buy risk assets with reckless abandon, as the central bank support which has dictated markets since the onset of the COVID-19 pandemic begins to be withdrawn.
However, with volatility comes opportunity – where active management will be able to play a larger role, and enable investors to maximise the economic benefit of their entry, or exit out of positions.
As always – diversification is key, especially when considering the heightened risk of non-economic related factors such as a potential Russian invasion of Ukraine, and the potential emergence of further COVID-19 variants.
The views expressed in this article are the views of the stated author as at the date published and are subject to change based on markets and other conditions. Past performance is not a reliable indicator of future performance. Mason Stevens is only providing general advice in providing this information. You should consider this information, along with all your other investments and strategies when assessing the appropriateness of the information to your individual circumstances. Mason Stevens and its associates and their respective directors and other staff each declare that they may hold interests in securities and/or earn fees or other benefits from transactions arising as a result of information contained in this article.
