
Putting the current Russia-Ukraine war aside for a day, higher and more sustained inflation is still front-and-centre for investment decision making, as well as the likely reaction function that central banks will have in dealing with their nation’s inflation dynamic.
Relatively speaking, Australia has a fairly small economy, where our financial markets are heavily influenced by exogenous factors, such as North American or European markets, despite there being nuanced and idiosyncratic differences.
Hence, when the market priced in an aggressive hiking cycle for the US Federal Reserve in response to >7% y/y headline inflation, it was no surprise that the Australian market started to do similar as well.
The problem is, there are quite stark differences between Australian and US inflation, and this should reflect more than currently priced in Australian bond and interest rate markets.
The US Curve
We should start by analysing the rise in US CPI last year, partly higher because CY2020 inflation was so low (negative for a time), making the year-on-year (abbreviated as YoY or y/y) increase overly large.
However, US CPI is still very high, the highest rate since the 1980s and even if we strip out base effects, is amongst the highest readings of the past 20 years.
Chart 1: US CPI Year-on-Year
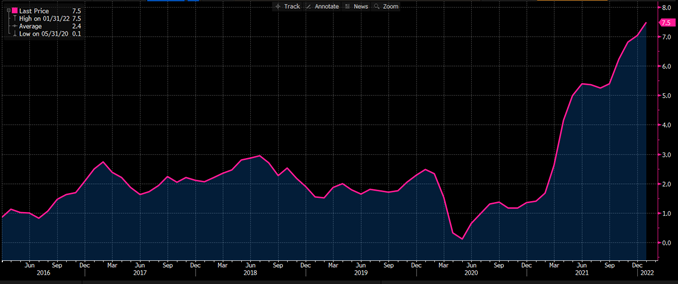
Source: Bloomberg, as at 2/March/2022
The most recent CPI print of 7.5% y/y for January added fuel to the fire that inflation was indeed staying above average and because of this longevity, was feeding into wage-bargaining processes where employees were demanding higher wages as compensation for their higher cost of living.
This creates the virtuous cycle of demand-pull inflation – an economic reference – a positive feedback loop that higher inflation sees workers ask for higher wages, higher wages creates additional purchasing power that if spent, creates a positive demand/supply imbalance, pushing up prices again in cyclic fashion.
As mentioned, this has fed into US rate hike expectations, where the market has priced a rise in the US cash rate from 0-0.25% at present to 1.2% by year-end, and up to 1.5% by the middle of next year, then no more.
Basically, a short and sharp rate hike cycle priced in, where the market is not keen to price any further hikes or cuts beyond 2024, due to the uncertainty involved with that length of time.
Chart 2: US Rate Hike Expectations
green = present, yellow = 6 months ago
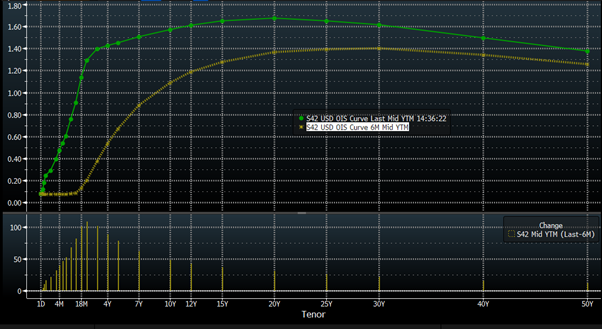
Source: Bloomberg, as at 2/March/2022
The AU Curve
Referring to the strong effect that US markets have on Australian, the domestic market saw a near equally dramatic change in rate hike expectations for the RBA, pricing in up to 1% of rate hikes this year (by the December RBA meeting) and a cash rate of 1.5-2% over the coming 2-4 years.
Chart 3: AU Rate Hike Expectations
Green = present, yellow = 6 months ago
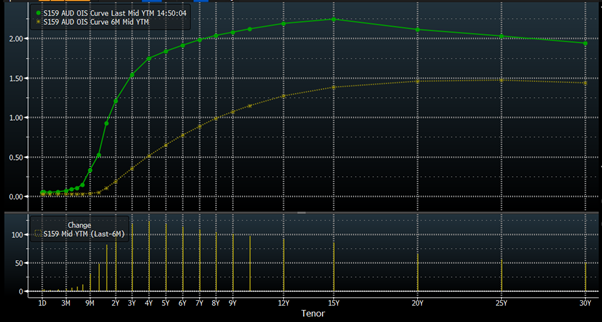
Source: Bloomberg, as at 2/March/2022
Notice how similar the AU curve is to the US?
Idiosyncratic Differences
Like always, the devil is in the details.
Australian CPI is nowhere near the US level, with headline CPI at 3.5% y/y as at Q4 2021, a far cry from 7.5% y/y (January 2022).
This already should inform quite a difference for rate hike expectations, where the outright level of inflation is 4% lower, meaning real interest rates in Australia are far higher than US – though still negative, they’re just a lot less negative.
The key differentiator is that US inflation is being caused by:
- stronger demand today than PRE-COVID levels
- supply disruptions that have caused supply to drop below pre-COVID levels for a time, but also not allowing supply chains to meet the swift increase in demand
- US fiscal stimulus measures providing direct cash payments to US citizens, creating an immediate demand spike
- US demand has accelerated due to a quicker re-opening than most nations, whilst those nations have reduced supply due to slower reopening
- Ultra-accommodative central bank policy supporting the mortgage market, leading to higher house prices, leading to higher rents, where “shelter” is a ~40% weight in CPI and is naturally pushing CPI higher
- A war between Russia and Ukraine that pushes up energy prices
Put all this all together and you’ve got 7.5% y/y inflation that may get to ~8% y/y, before starting to ebb back downwards.
Australia, however, did not have the same level of fiscal spending/support accelerating demand, we also had slower reopening and more lockdowns than the USA.
While we are also affected by higher energy prices and accommodative central bank policy, we have much lower inflation because of less (relative) demand and less (relative) supply issues, compared to the USA.
Pathway for the RBA
It’s about time we addressed the disconnect between market pricing and the RBA’s current guidance.
As it stands, the RBA’s Q4 Statement of Monetary Policy (SoMP) and the statement after their March 1st Policy Decision has the RBA remaining patient at present, waiting for future CPI and wage-price data (primarily the Wage Price Index (WPI)) to confirm to them that current inflation and future inflation will average higher sustainably, and stay within their 2-3% p.a. target band.
Quoting the key paragraph in their March statement:
“The Board is committed to maintaining highly supportive monetary policy conditions to achieve its objectives of a return to full employment in Australia and inflation consistent with the target. The Board will not increase the cash rate until actual inflation is sustainably within the 2 to 3 per cent target range. While inflation has picked up, it is too early to conclude that it is sustainably within the target range.”
That’s very clear, we need to be aware of what conditions will indicate that inflation is sustainably higher.
The data the RBA is looking for is contained in quarterly readings of the Consumer Price Index and the Wage Price Index, given the current readings aren’t sufficient.
The nuance is that this data is lagged and produced quarterly, so for the RBA to get the confirmation they’re looking for, it’ll take some months.
| RBA Meeting (CY2022) | CPI | WPI |
| Apr 5th | Q1 on 27/April | |
| May 3rd | Q1 1/June | |
| Jun 7th | ||
| Jul 5th | Q2 on 27/July | |
| Aug 2nd | ||
| Sep 6th | Q2 7/Sep | |
| Oct 4th | Q3 on 26/Oct | |
| Nov 1st | ||
| Dec 6th | Q3 early Dec, not scheduled | |
| No Jan 2023 meeting |
Source: RBA, ABS
The above schedule is why the market is pricing in rate hikes from ~July-August, and as mentioned, at least 4x25bp rate hikes, likely in four separate meetings.
For example, if you are an economist that believes Q1 WPI will be hot, and Q2 CPI even hotter, you could have your 1st rate hike pencilled in for the RBA’s 2/August meeting.
This timeline allows subsequent rate hikes to be factored in for Sep-Oct-Nov-Dec (or at least 3 of the 4) to get the cash rate to 1.2% by year-end.
However, you could be more inclined towards the RBA requiring Q2 WPI to be the key dataset, where then their 4/October meeting is the live date, and then you’re either factoring in 50bp hikes or else you can’t get to the 1.2% cash rate.
Chart 3: AUD/USD Implied Forward Rates + ASX Cash Rate Futures
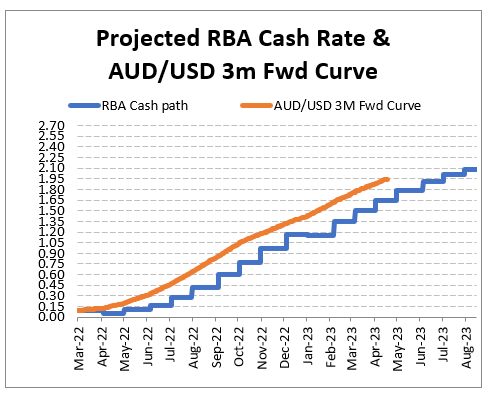
Source: Bloomberg, Mason Stevens
Closing Remarks
To be clear, I’m in the latter camp where lift- off is likely August after a stronger Q1 WPI and Q2 CPI, and the RBA hikes twice by year-end – all else remaining equal given there’s large unknowns looming, such as a possible new COVID variant as well as Russia-Ukraine war escalating further, hurting economic growth and global business and consumer confidence.
As always, that view is evolving as a weak Q1 WPI could cut all expectations of rate hikes this year, depending on the result.
The other unknown on our minds is the sentiment impact that rising borrowing costs will have own mortgage payers; where already fixed-rate mortgage rates have risen across 1-5y terms this year by some 50bp, and variable rates likely move higher if/when the RBA does hike.
The response these mortgage payers have will be interesting, as while serviceability is near all time-best conditions, there may still be a reaction where investors sell property and rotate their funds elsewhere.
For example, say the RBA hikes 4x25bp by June 2023, and variable mortgage rates increase by the same amount and capital city property prices decline 5-10%, how many will sell and how many will hold? That’s the thought problem we’re dealing with, that’s a known unknown factor.
The views expressed in this article are the views of the stated author as at the date published and are subject to change based on markets and other conditions. Past performance is not a reliable indicator of future performance. Mason Stevens is only providing general advice in providing this information. You should consider this information, along with all your other investments and strategies when assessing the appropriateness of the information to your individual circumstances. Mason Stevens and its associates and their respective directors and other staff each declare that they may hold interests in securities and/or earn fees or other benefits from transactions arising as a result of information contained in this article.
