

I was reflecting on the speed of change in markets. If we think back to Covid – that was the quickest bear market we have ever seen. This half we have essentially seen the most material shift in the yield curve in the shortest amount of time. If we think through the next decade as opposed to the last two, we will likely see inflation volatility, which means we are likely to see shorter/quicker economic cycles. Which means shorter/quicker market cycles as well. Which brings me to share a Goldman Sachs chart from 2020 which depicts the phases of an equity market. The equity market moves from despair to hope, to growth and then to optimism and then we do it all over again. We don’t learn and it doesn’t change; fear and greed will always drive sentiment one way or the other.
The causes may be different, but the cycle remains the same.
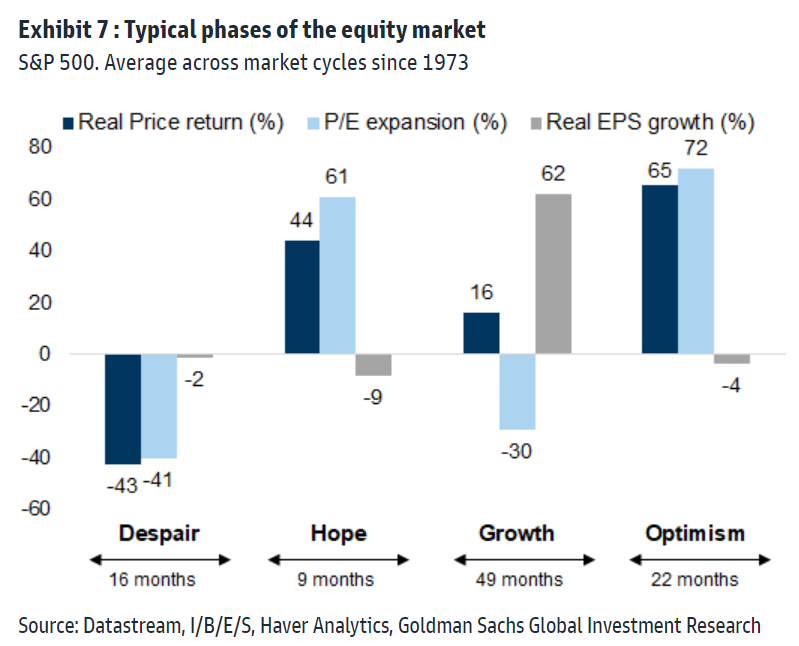
The drivers of the market through those phases are different. To state the obvious, the market is currently in the despair phase. PE’s have fallen, prices have fallen and EPS is yet to fall. Whilst the chart shows the average time it takes for each phase of the market since 1973, I would purport that I think the phases are shortening. The next step is for earnings to fall and that is what the market has shifted its attention to. However, it is important to recognise that earnings do not need to bottom before the index will turn. We will shift into the Hope phase of the market at some point, PE’s will expand, earnings will fall but the overall market will rally. This time IS NOT different – it is always the same.
Source: Citigroup
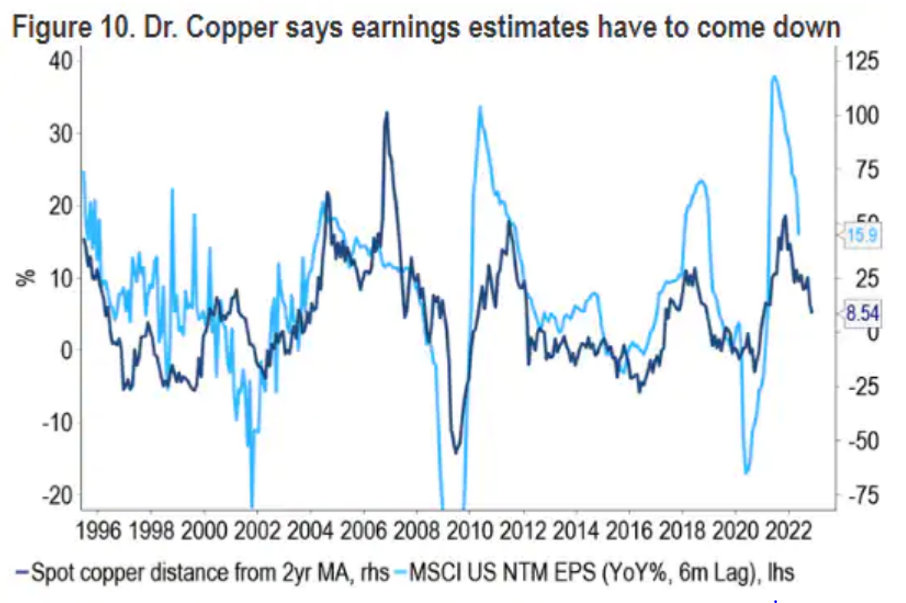
So where are we in the despair phase of this market? Unfortunately, earnings forecasts are still very much positive circa +10% so I would suspect this number needs to fall to at least 0% subject to the depth of the recession we are now odds on to have. Importantly NORMALLY equity markets usually bottom before recessions and equity markets NORMALLY are already rising by the time the recession is underway.
To that end what happened last week? The Atlanta Fed’s GDPNow tracker suggests 2Q US GDP will fall by 2.1% meaning that the US is already in recession given the 1Q GDP print of a decline of 1.6% (two quarters of negative GDP fitting the technical definition of recession). To the extent that bad news is good news, the closer we are to recession the closer we are to the eventual fed pivot and the Hope phase of the market.
At this stage given there is little evidence to find comfort that inflation is contained; the Fed stance is still solidly hawkish. However, we are starting to see companies highlighting a sea change between the last quarter and (in some instances) the last two weeks. We note that many retail companies around the world have an elevated inventory position, with the companies having brought forward inventory (because of supply chain concerns) at a time when sales seem to be slowing. Moving sectors, we saw Micron guide for QoQ revenue to fall 17%, noting consensus estimates was UP 6% QoQ. Survey measures of both business and consumer sentiment are now beginning to slow somewhat more notably. The Conference Board’s consumer confidence index fell to 98.7 in June, its lowest level since early 2021, while ISM manufacturing dropped to 53.0 in June. We typically find ISM and PMI indices to be more reliable indicators of real business activity than consumer confidence measures are for consumption patterns. Durable goods orders were strong in May in line with still-expansionary levels of ISM new orders last month. However, the drop in ISM new orders below the 50-level to 49.2 in June as well as anecdotes in the ISM report suggest that demand for manufactured goods is at least stabilizing and likely starting to moderate from very high levels.
The point is that as noted above the speed of the slowdown may surprise and furthermore we may already be in recession. This is why we are seeing the long end of the curve beginning to fall and arguably possibly in the process of inverting. Adding duration is certainly starting to make sense in our view. Between now and the eventual fed pivot, we may be in for a continued bumpy ride as central banks try to use a blunt tool to bring down inflation fuelled by both supply side challenges and above trend growth. Importantly financial conditions do seem to have tightened sufficiently to at least start the process of demand destruction.
The biggest risk from here remains in our view the path of inflation. Communications from Fed officials since the June FOMC meeting have been largely in sync, with even the doves emphasizing the need to control too-high inflation even if that comes at the expense of softer growth. For now, all Fed officials seem to maintain the base case of a “softish” landing, but Chair Powell did again acknowledge that avoiding a recession is a difficult task in an appearance at the ECB’s policy forum this week.
Cleveland Fed President Mester also added her support for another 75bp hike at the July FOMC meeting this week. While this is not too surprising from a relative hawk, some of her comments around inflation expectations are worth noting. In particular, she stressed that the Fed should not be complacent around rising longer-term inflation expectations, which could be at risk of becoming more unanchored.
Even though 5-10 year University of Michigan inflation expectations were revised down to 3.1% from 3.3% in the final June reading, the initial jump was likely enough to raise alarm bells for many Fed officials. Longer-term inflation expectations that are still roughly consistent with 2% are one of the last encouraging signs of the Fed’s ability to ultimately re-achieve its target. Keeping these well-anchored is likely viewed as key to avoiding a repeat of the 1970s when a moderate slowdown was not enough to ease high inflation that was already well-entrenched in the economy. The Fed’s recent commitment to seeing a string of softer realized inflation prints could be partly to reaffirm the Fed’s credibility with the public and insure against inflation expectations climbing even higher.
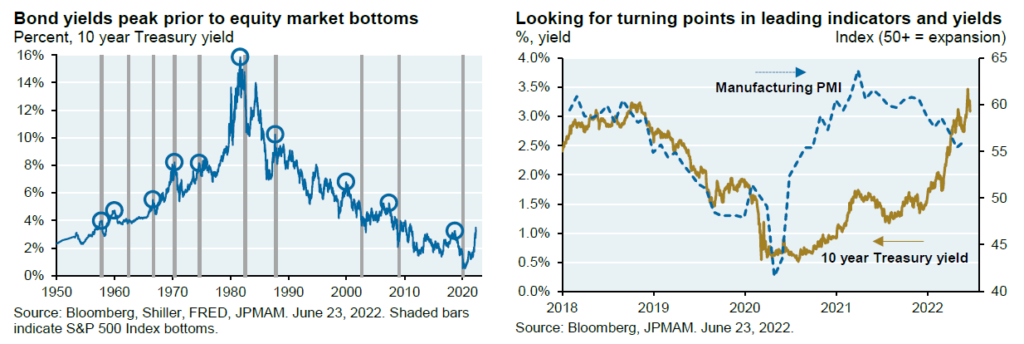
So, what do we do from here? Some of Michael Cembalest’s latest article is relevant here. He highlights the use of PMI data as these represent some of the best leading indicators. He expects these surveys to continue to fall but will be focussed closely on turning points. Another equity market signal: in past cycles, equity markets did not bottom until long term Treasury yields were declining, or at least until they stopped rising. The first chart below shows 10-year Treasury yields; the vertical bars represent equity market bottoms. In the last three cycles, bond yields started falling well before the equity bottom. From 1950 to 1982 when rates were rising on a secular basis, Treasury rates hit their peak right at the equity bottom. So, while I’m not a technician, a sign that the PMI index has bottomed out and that Treasury yields have peaked would be a good sign for investors, even as economic data are still deteriorating.
For now we wait (subject to how underweight you are), in our opinion the drawdown in equities is probably in its 7/8th innings but volatility will remain as long as the risk of inflation becoming unanchored remains.
The views expressed in this article are the views of the stated author as at the date published and are subject to change based on markets and other conditions. Past performance is not a reliable indicator of future performance. Mason Stevens is only providing general advice in providing this information. You should consider this information, along with all your other investments and strategies when assessing the appropriateness of the information to your individual circumstances. Mason Stevens and its associates and their respective directors and other staff each declare that they may hold interests in securities and/or earn fees or other benefits from transactions arising as a result of information contained in this article.
