
“And if you said this life ain’t good enough,
I would give, my world, to lift you up
I would change my life, to better suit your mood”
Santana ft. Rob Thomas – Smooth (1999)
32.9 million Americans received some sort of unemployment benefit last week.
This is 23.77% of their workforce.
However, the official unemployment rate (“U-3”) is 11.10%
Something doesn’t add up.
Data Problems
We need to re-think how we classify someone as being employed.
Some workers are currently furloughed, with their employer intending (but not promising) to bring them back to work when possible. Meanwhile they may or may not be collecting unemployment benefits.
Others are effectively furloughed because they aren’t working but are still on their employer’s program with help from worldwide programs such as JobKeeper or PPP in the USA. Are they jobless or not?
Then there’s people who are still employed but working fewer hours or for lower wages.
Then you have independent contractors such as Uber drivers, who aren’t formal employees.
In previous recessions they wouldn’t have received any benefits, but this time the CARES Act ensures that they may be able to – though that’s subject to each state’s implementation of the Act.
The difference in the data
Modernly, you are considered unemployed if you are able to work and seeking work, but not working.
Yet now millions can work, but aren’t looking, because they expect to be called back to work as economies reopen, but maybe not.
Hence, not considered unemployed as not looking for work.
Then there’s also the difference between the numbers of persons filing for unemployment benefits versus the survey the Bureau of Labor Statistics (BLS) conducts – as state agencies aren’t able to process the claims fast enough due to the inundation of claims, many are unemployed but not receiving benefits.
As they aren’t receiving benefits, they aren’t counted in the Job Claims data, but they would be recognised as unemployed in the unemployment survey.
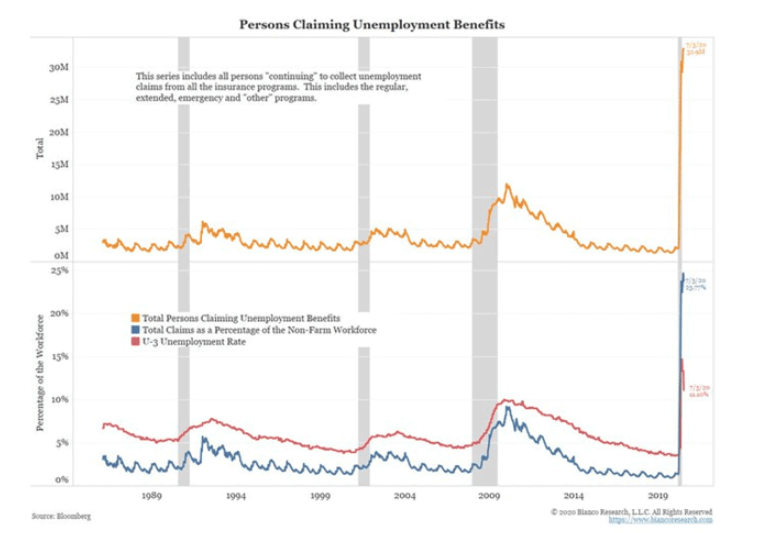
Source: Bloomberg, Blanco Research
Unemployment has become more nebulous and esoteric in measurement, and it could be argued the current classification mis-represents the severity of the current recession.
Let’s talk about what we’re missing in the hard numbers:
Numerous financial indicators seem to be forecasting recovery in a quicker period than unemployment figures indicate – which requires people to return to work, but also for those wage-earners to spend what they earn.
This has two obvious complications:
- there may be a long period of time until persons that are not working currently return to work; and contractors to return in such capacity they are earning similar wages to pre-COVID levels;
- there needs to be certainty households and business won’t experience future job losses, or an incentive for savings to be deployed via consumption and investment. Otherwise savings may continue to rise despite unemployment returning to normal, yet no uptick to economic activity.
Returning to work
Here’s a chart comparing this year’s percentage job losses with prior US economic recessions:
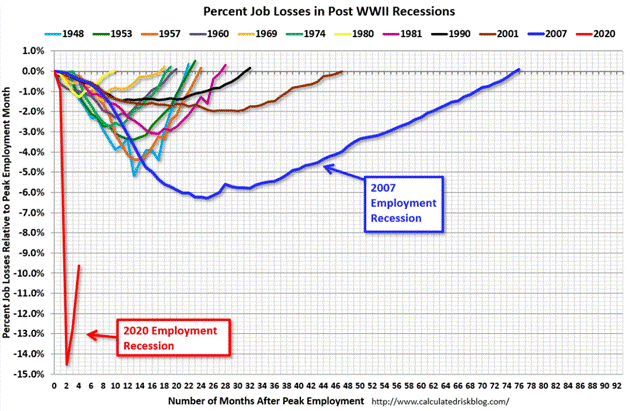
Source: Calculated Risk
The red line is where we are right now.
In 2007 it took the US close to six years to return employment back to pre-GFC levels.
If we follow a similar timeframe, we will not return back to a normal jobs environment until 2026.
The RBA has already indicated they won’t need to raise the cash rate for another three years, at a minimum. It may likely be longer.
Hence, investing based upon a “V-shaped” recovery will be assuming the red line above continues in trajectory to 0% within 12 months from now, and that we recover more quickly from this crisis than any other since WWII.
As well, temporary job losses can eventually turn into permanent job losses.
So far this crisis, we’ve had the same permanent job losses in 4 months that took nine months in 2007, and over 12 months in 2001 recession.
This has potential to keep getting worse before it gets better due to the nature of changing consumer preferences.
A century ago consumer preferences changed over years or decades – now they can change in weeks and months.
This means that industries that have seen movements away from their goods and services may lose jobs through decreased demand, with little likelihood for persons to be employed in the same job again.
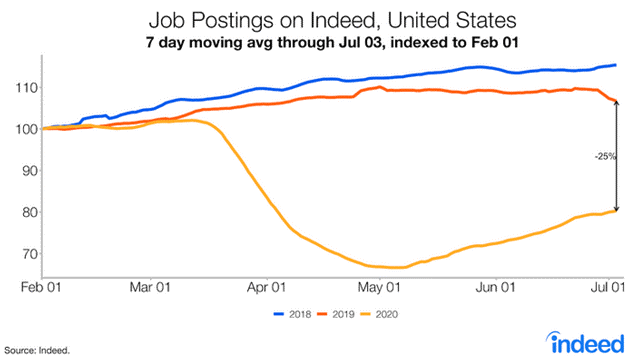
Indeed.com, a large job searching site in the US, similar to our SEEK.com, is a good barometer for hiring activity.
While the US was re-opening at the end of June and into early July, there has been no material increase in job advertisements.
As at 1 July, activity is still 25% lower than 2019 levels, similar to the decline in true unemployment.
Household (Un)Certainty
Consumer sentiment began to return in May and June, though declining once again in latest readings.
Also, this is quite varied by level of income.
The data from Morning Consult Economic Intelligence depicts the difference by US income per household.
i.e. lower income earners are more uncertain compared to higher income earners.
This is intuitive, as higher income earners are generally in less affected industries – with greater ability to work from home – and less likely to seek government benefits during the crisis.
Moreover, they generally have large savings pools that can be drawn upon during economic stress.
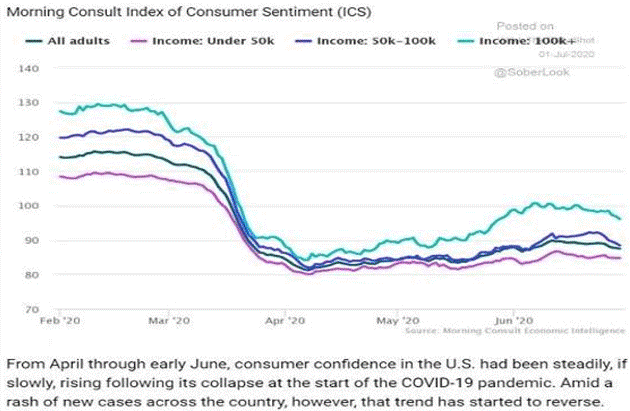
Source: Morning Consult Economic Intelligence
Closing Remarks
Government programs and safety nets can help, but they aren’t magic and won’t return economic output (GDP) and jobs to pre-crisis levels.
For these reasons it is hard to agree with forecasts of quick economic recoveries, V-shaped recoveries etc, as they are underpinned by notions of labour markets returning to normal despite shifting consumer behaviour, and higher savings rates due to fear and uncertainty.
We may begin to see this reality priced into financial markets, with US corporates producing latest earnings, revenue and guidance this week – and Australian companies to release their equivalent results in the near future.
The views expressed in this article are the views of the stated author as at the date published and are subject to change based on markets and other conditions. Past performance is not a reliable indicator of future performance. Mason Stevens is only providing general advice in providing this information. You should consider this information, along with all your other investments and strategies when assessing the appropriateness of the information to your individual circumstances. Mason Stevens and its associates and their respective directors and other staff each declare that they may hold interests in securities and/or earn fees or other benefits from transactions arising as a result of information contained in this article.
