
The US Bond market rode a rollercoaster last month, starting down the road that leads to strong action by the Fed and doing a sharp U turn to price for a swift end to inflation as the key factor in Fed monetary policy.
The Fed reconfirmed at their December 14 meeting that they really weren’t kidding about the need for rates to stay restrictive for some time yet and challenged the received wisdom that the rate moves would almost certainly bring along a slowdown as soon as Q3 2023. Bond markets sold heavily into year end convinced rates would be higher for longer.
Here we are only weeks later and a series of slightly better than expected growth and inflation data has markets contemplating the mythical soft landing being the central probability. Markets are suggesting the inflation genie may be back in the bottle a lot sooner than the Fed has projected.
Figure 1: US yield curve over the last month
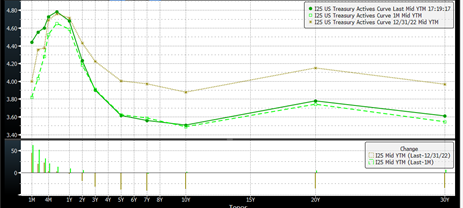
Source: Bloomberg
The light green line above is the US yield curve a month ago, the dark green line Friday 13 Jan’s close rates. For year end in khaki, panic in the market that the Fed would keep to its stated objective saw a 35 basis point selloff. This has completely unwound as data released in January supports the view that higher rates are working and the economy can get prices lower without a sustained restrictive monetary policy setting.
The Fed uses a range of data to justify and refine their monetary policy and many of their forward indicators are falling into line with a moderation of pricing pressures. The notable exceptions are wage and services inflation, more on that shortly. Janu Chan of Bitesize Economics prepared the 3 charts below outlining the trajectory of several of these measures.
Figure 2: US Inflation and Oil Price
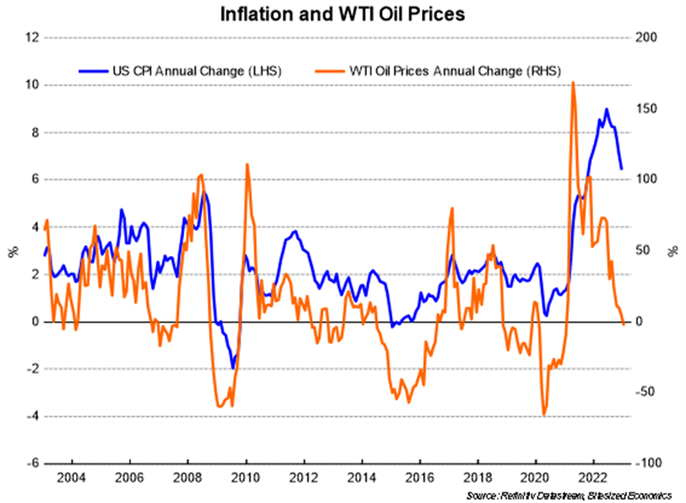
Source: Refinitiv/Bitesize Economics
Figure 3: US Inflation and non-Manufacturing Prices Paid by businesses
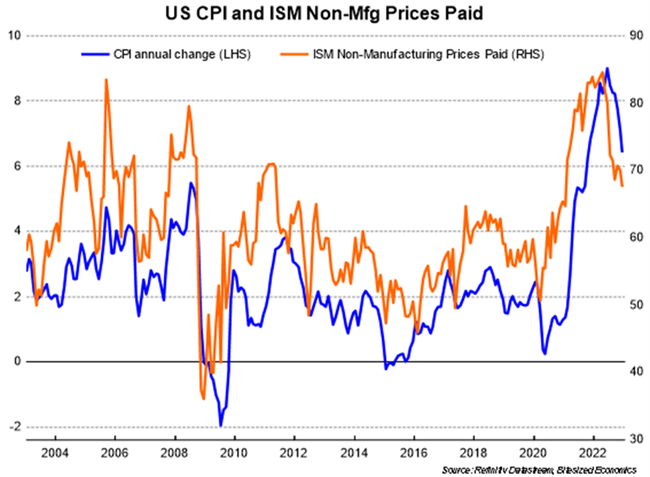
Source: Refinitiv/Bitesize Economics
Figure 4: US Inflation and Small Business Selling Prices
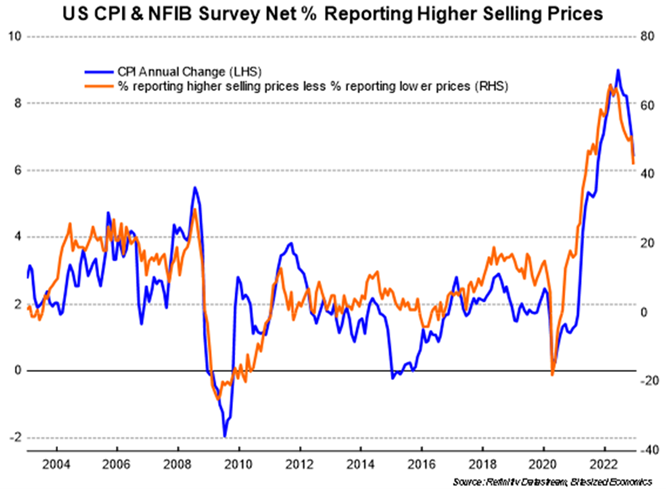
Source: Refinitiv/Bitesize Economics
If this inflation pulse was a supply side story (and it has played out that way) we would expect that once the shocks are over there will be a deflationary impulse as the windfall pricing unwinds. All the indicators above seem to be following that pattern and the Fed is broadcasting a potential to slow the pace of rate hikes once again with a 25bps move in February.
US Markets continue to believe that rates will be on the way down by the end of 2023, despite many attempts by the Fed to convince them of both their resolve and the economy’s resilience. Bond markets seem to be ignoring the glaring evidence that wages and services are still catching up to the price rises in goods and commodities that hit early last year.
Figure 5: US Inflation and Wages
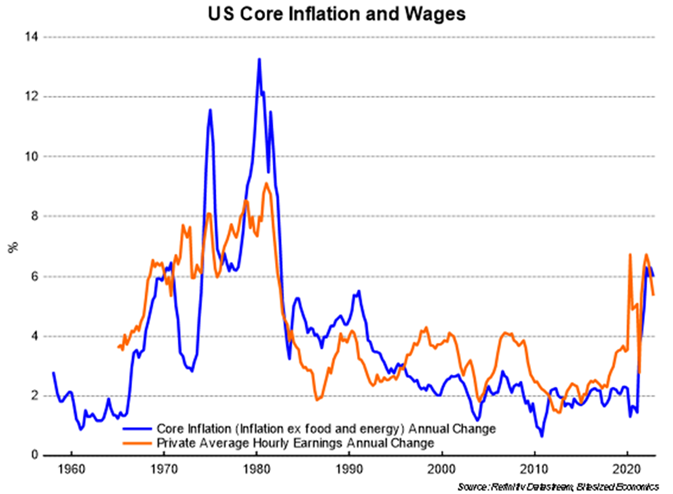
Source: Refinitiv/Bitesize Economics
Figure 5 clearly shows that the move lower in core CPI has not yet triggered a move lower in the growth in wages. Added to the wages story is they strength of services as a contributor to US inflation and the optimism in the US that rates will decline by year end seems brave.
Figure 6: US Inflation by sub sector
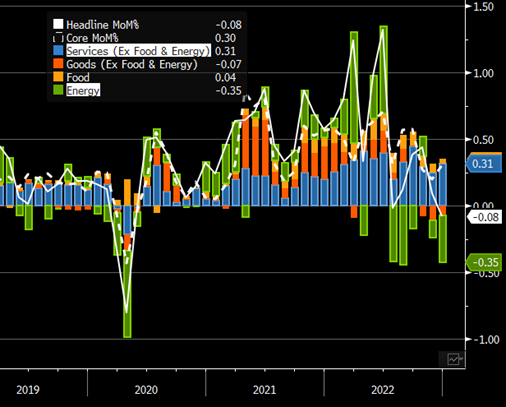
Source: Bloomberg
Figure 6 shows clearly that as Energy prices provide relief, service costs are showing no signs of reversal. The US yield curve noticed that for a week or two in late December but dismissed it my mid January. It is as if inflation fighting is now a rear view rather than still too be seen feature for the Fed. The volatility in the Bond market when it takes this skittish approach is unlikely to temper as we will see this seeming divergence in the inflation pulses for some time yet.
The ramifications for Australia are more connected to that volatility than to the question for rate trajectory. Unlike the US, Australia has a positively shaped yield curve with the market sensibly understanding that the RBA will be facing this sticky wage and services catch up for some time, but also knowing that the effect of rate hikes in an economy where most borrowers play floating rather than fixed rates is much more than in the US. Our curve also expects a far lower terminal rate in this hiking cycle than the US. The main impact the last month had for Australian rates was a mimicking of the odd quick hike quick cut scenario for the next couple of years but unabated good times and growth to follow.
Figure 7: AUD yield curve over the last month
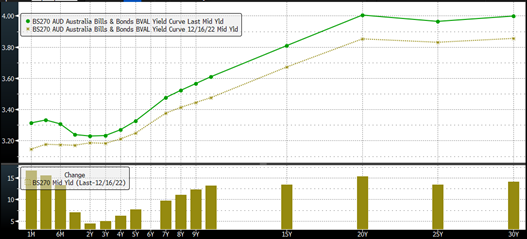
Source: Bloomberg
Both curves are telling an inconsistent story, both are suggesting the majority of the work to tame inflation is done and the Aussie curve is telling us that growth and prosperity are just around the corner with the US extremely worried about over tightening strangling growth in 2024. Markets will remain volatile while the inconsistent data and expectations continue, and anything but a soft landing now will be the outlier, which feels uncomfortable. According to the bond market, the inflation work is done.
The views expressed in this article are the views of the stated author as at the date published and are subject to change based on markets and other conditions. Past performance is not a reliable indicator of future performance. Mason Stevens is only providing general advice in providing this information. You should consider this information, along with all your other investments and strategies when assessing the appropriateness of the information to your individual circumstances. Mason Stevens and its associates and their respective directors and other staff each declare that they may hold interests in securities and/or earn fees or other benefits from transactions arising as a result of information contained in this article.
