
A local bank is trialling an ATM built into a tree.
If it’s successful, they might expand to other branches!
It’s my pleasure to provide an update of the domestic banking sector, simply because I’ve had a chance to use the above joke.
I’m also patiently waiting for a day where I can write about pirates too, but alas, it isn’t an investible topic…
As for the banks, this note proceeds numerous upcoming earnings announcements where;
29-July: Macquarie Group (ASX: MQG) hosts their annual general meeting
11-Aug: CBA releases their financial year result
12-Aug: NAB produce their 3Q 2021 trading update
16-Aug: Bendigo Bank (ASX: BEN) also release their financial year result
And we also get Pillar 3 filings from ANZ and Westpac (ASX: WBC), without any large earnings updates.
What’s interesting, is that proceeding these 30-June updates from the banks, we’ve already seen a large amount of economic data released that will indicate where the bank earnings will likely come in at.
So in today’s note, we’ll take the opportunity to canvass all these details, as they’re from sources not widely utilised by investors such a regulatory filings.
APRA Banking Data
The Australian Prudential Regulatory Authority (APRA) releases a monthly data series providing an update of deposit and loan-level data, which is a forward indicator for bank growth, prior to quarterly earnings.
As of today, we’ve been updated to 31-May, which is an invaluable indicator for how Q2 earnings may have flowed.
For those interested, you can find the direct link to the APRA banking statistics here.
What we know so far is that national deposit growth has stabilised to around 6% y/y, which is well off the deposit deluge of 2020, but is still slightly above long-term average deposit growth.
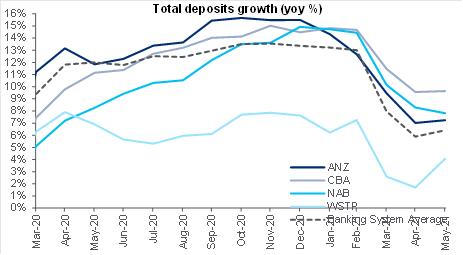
Source: APRA
This has been a source of relatively cheap funding for the banks – particularly the major banks – as a large portion of their retail deposits are “at-call” deposits, paying at or around 0% p.a., at present.
On the other side of the balance sheet, total loan growth has picked up to around 2%, driven by improving lending volumes across investors and owner-occupier mortgages.
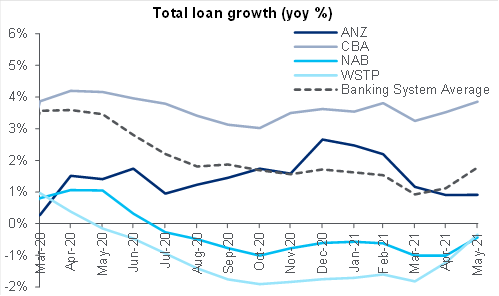
Source: APRA
There have also been some signs of life for business loans too, though in very small numbers and off the COVID-19 lows.
While we won’t likely see these business loan volumes drop in bank earnings announcements, we’ll see this again impact results in Q3 2021.
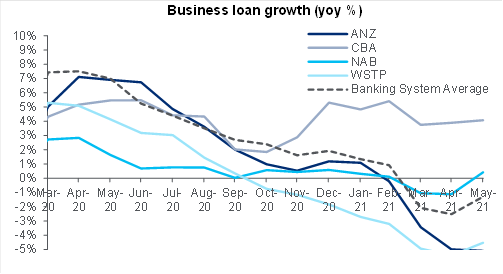
Source: APRA
In aggregate, deposit growth is still greater than lending growth; which highlights we’re still in a subdued economic environment, where confidence is muted and there is still a high degree of uncertainty about future economic conditions.
Altogether, this means that businesses and households are less likely to borrow funds from a banking institution given the high degree of uncertainty, which will continue the trend of deposit growth > lending growth.
At Mason Stevens we’re specifically aware of this relationship, as when deposit growth > lending growth, there’s usually a contraction in corporate bond issuance, at a time when higher savings sees more money allocated to defensive assets, such as fixed income securities.
This creates a “double whammy” positive effect, where less supply and more demand are very positive for Australian fixed income.
While the RBA’s Term Funding Facility (TFF) has now expired – a source of cheap funding for banking institutions at 0.10% (the same as the Overnight Cash Rate) – banks will not need to return to the market and issue senior bonds, especially while NSW is under lockdown and deposit growth outstrips lending growth.
Capital Ratios and Buybacks
In 2020, APRA limited Australian banking institutions’ ability to pay dividends or conduct share buybacks, as a means to preserve the retained capital on their balance sheets, that may be needed to buffer against loan losses as a result of the pandemic.
As these large loan losses did not eventuate, APRA is allowing banks to potentially issue dividends and transact buybacks, on a case-by-case basis.
We’ve seen this already from ANZ last week, announcing a 1.5 billion AUD buyback, due to its capital surplus.
This was a surprise to some, given COVID-19 delta strain concerns and potentially more lockdowns across the country, nonetheless, ANZ was undaunted.
In order to analyse the capital adequacy of these banking institutions, we must look at their Common Equity to Tier-1 capital ratios (CET1), where our banks are at (as of 31-March):
- NAB, 12.4%
- ANZ, 12.4%
- WBC, 12.3%
- CBA, 12.7%
The main hurdle to be aware of here is that APRA has all 4 banks targeting a 19% CET1 level by 31 Dec 2023 (by 2024), which means they’re nearly there, already.
This has given them some breathing room, and allowing potential dividends/buybacks to occur as a boon for shareholders.
I recently read idiosyncratic research from Citi’s equity research team that highlighted the major banks have over 20 billion AUD of “surplus” capital above CET1 requirements at present, where ANZ alone had 8 billion of that, before announcing their 1.5 billion AUD buyback.
This makes it very likely that all four major banks issue buybacks in the near future.
Also, we’re probably at peak hybrid issuance too, where they are more likely to issue more subordinated (Tier 2) debt, as a cheaper source of capital rather than more expensive hybrids.
| ANZ | CBA | NAB | WBC | ||
| Reporting Date | 31/03/21 | 31/03/21 | 31/03/21 | 31/03/21 | |
| Risk Weighted Assets (RWA) | 408,166 | 446,657 | 417,610 | 428,899 | |
| Core Tier 1 capital (CET1) | 50,786 | 56,725 | 51,648 | 52,932 | |
| Additional Tier 1 Capital (AT1) | 7,645 | 10,720 | 6,839 | 9,468 | |
| Total Tier 1 Capital | 58,431 | 67,445 | 58,487 | 62,400 | |
| Tier 2 Capital | 16,464 | 19,206 | 16,258 | 16,657 | |
| Total Capital | 74,895 | 86,651 | 74,745 | 79,057 | |
| CET1 Ratio | 12.40% | 12.70% | 12.40% | 12.30% | |
| AT1 Ratio | 1.90% | 2.40% | 1.60% | 2.20% | |
| Tier 2 Capital Ratio | 4.90% | 4.30% | 3.90% | 3.90% | |
| Total Capital Ratio | 18.30% | 19.40% | 17.90% | 18.40% | |
| Leverage Ratio | 4.00% | 6.00% | 6.00% | 6.30% |
Source: Mason Stevens, ASX and APRA financials and filings, all figures in AUD hundreds of thousands. For example, ANZ RWA “408,166”is 408.166 billion AUD
Loan Origination
Another part of earnings season I can foresee as being a surprise for bank equity owners is the changing composition of bank lending books, where there has been a surge in issuance of fixed-rate mortgages, locking in rates for 1-5 years, as opposed to the usual majority weighting of variable (floating) rate mortgages.
A lot of this came from the perception that interest rates were too low and going to move higher within the next 2-5 years, and investors were economically inclined to fix at those levels, lest they pay higher borrowing costs when they rose under a variable structure.
We called this one correctly ourselves, writing a note on the topic on 21-April, and we saw fixed-rate loan rates rise in early May.
Despite fixed-rate mortgage rates increasing in May and June, they were still a historically high portion of CBA’s lending, as at 30-June:
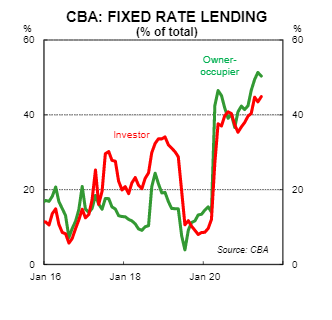
Source: CBA Economics
This is very likely good business for the bank – and likely other lenders issuing fixed-rate mortgages – where their funding costs have been decreased through higher deposit funding at low interest rates, and the RBA’s TFF program too.
What should be no surprise is that bank net interest margins (NIM) may increase since 31-March financial updates, where fixed-rate mortgage origination locks in the differential between funding costs and the mortgage rates, for the coming years.
A hypothetical example:
CBA has a weighted average cost of funding of 0.5% p.a.
CBA can issue 3-year fixed-rate mortgages at 2.5% p.a.
They are therefore locking in a NIM of 2% p.a., a very healthy margin!
On top of this, as capital city house prices have increased dramatically over the past year, average loan size has also grown.
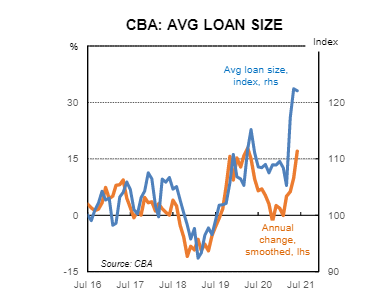
Source: CBA Economics
This means that banks are potentially locking in higher NIM, multiple years into the future, across large loan sizes.
The downside is that loan volumes are lower because of COVID-19 infections and subsequent lockdowns, but shows that there could be a lot of upside to banks should the pandemic abate over the next 2 years and lending volumes take off once again!
Closing Remarks
We hope in reading this note that you’re aware of the interesting dynamic of the current domestic banking market, where our well capitalised banks are not booking large losses and are able to buyback some of the shares that they issued last year, to buttress their results during the height of the pandemic in March/April 2020.
As such, we should be aware that others may not be as aware of this dynamic, which may prove to be a short-term positive to bank share prices, and also medium-term positive for credit bonds and fixed income flows.
The views expressed in this article are the views of the stated author as at the date published and are subject to change based on markets and other conditions. Past performance is not a reliable indicator of future performance. Mason Stevens is only providing general advice in providing this information. You should consider this information, along with all your other investments and strategies when assessing the appropriateness of the information to your individual circumstances. Mason Stevens and its associates and their respective directors and other staff each declare that they may hold interests in securities and/or earn fees or other benefits from transactions arising as a result of information contained in this article.
