
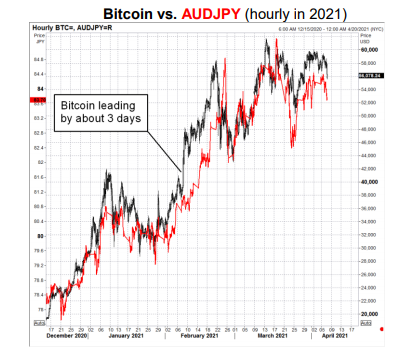
Last week our trading team were analysing the short-term correlations between the price of Bitcoin and the traditionally risk-on/risk-off currency pair, Australian dollar versus Japanese Yen (AUD/JPY).
Why AUD/JPY?
Because AUD is traditionally a risk-seeking currency associated with growth and international trade, whereas JPY is associated with safe-haven and slow, stagnant economic growth.
What we found is that when Bitcoin’s price deviates by a large amount in a short period of time – either higher or lower – this effects AUD/JPY.
When Bitcoin moves ~+2-3% higher, AUD/JPY rallies in the following hour, and vice versa.
This prompted the more general question, what causes cross-market correlation?
The answer is not so simple, but there are seven main ways that distinct financial assets and markets can correlate with one another.
However, a question worthy of a detailed answer, and a write-up as a “morning note”.
#1 Arbitrage and Substitution
Arbitrage comes in many forms, but in its purest form it’s “risk-free” where you can buy one asset at a price in one venue and sell it at the exact same time in another venue, at a higher price.
For example, if you were able to buy gold futures on the London Metals Exchange at $1800/ounce and sell via the Comex at $1850/ounce – assuming no brokerage, storage or insurance costs – you would do this trade at a risk-free profit all day until the market eventually corrects the discrepancy and prices converge.
These opportunities have receded in the last two decades, as more and more people are aware of the opportunities, and computers can be programmed to immediately take advantage of them when/if they occur – much quicker than a person can.
However, whenever new assets or products are created – such as Bitcoin – opportunities can present themselves.
#2 Third-variable Response
Often when two assets move up or down together, they are responding to a third variable that relates to them both. This is the most common driver of correlation and the original premise for our Bitcoin vs AUD/JPY scrutiny.
For example, if the USD was to decline in value, our AUD may rally, and potentially other “risk-on” currencies such as Norwegian Krona (NOK), Canadian Dollar (CAD) or New Zealand Dollar (NZD). This doesn’t mean that AUD and NOK are immediately linked, they’re merely both reacting in harmony to the USD decline.
#3 Cash flows
It is also fairly common for cash flows from assets to be catalytic for an investment or trading decision.
Say for example you are the Treasurer of an Australian mining company that sells your iron ore production into the global market. Iron ore is valued in USD, where your receipts – the proceeds of iron ore sales – will be based in USD. This means you are always subject to volatility in the AUD/USD exchange rate.
If market production is low relative to market demand and iron ore rallies, then you will have more USD receipts, that you’ll need to sell in order to repatriate funds to AUD, to pay shareholders. This would create a sell USD, buy AUD FX transaction, that if done in sufficient size, may see AUD rally against USD.
The nature of this relationship is well known and is a key reason our AUD rallies when metals prices rally, or NOK and CAD rally when oil prices rally.
#4 Cross-ownership and forced-selling
Macro-economic thematic investing, or multi-asset investing can create broad correlations between different asset classes.
For example, the current “reflation” narrative has seen investors broadly take the following positions;
- Short US government bonds, EUR/USD
- Long USD/JPY, AUD/USD EM equities, property and infrastructure.
This relationship is also evident in “group think”, where for example, a slew of poor economic performance from two EM nations such as Brazil or Turkey will see investors also sell their other EM exposures such as South Africa or Indonesia, whom may not be related.
When there is significant movement in one of these assets – where a broad consensus is positioned the same way – this may elicit profit-taking or stop-loss trading, where assets move in concert.
#5 Correlation trading, algorithms
Correlation trading is a sophisticated trading strategy where statisticians trade the known and perceived correlations between assets, on short time horizons, to profit (or loss) from market price inefficiencies.
This is similar to Cash Flows, where known correlations see asset prices move in tandem, when a price event occurs.
The process creates a self-fulfilling prophecy, i.e. reusing the oil analogy: if oil was to rally $2/barrel higher, traders would immediately buy CAD or NOK against the USD.
#6 Volatility and systemic risk
When systemic risks rise – pervasive market risks – risky assets tend to fall and correlations rise.
This is also known as the “sell everything” response where when reacting to extremely bad news, fund managers and traders will sell their “risk” assets quickly, and raise cash, rather than take the time to think about which assets are most affected or whether the price action is mis-aligned with fundamental valuations.
We saw many examples of this last year, where investors sold equities, infrastructure, listed property, credit bonds, all with equal abandon, in order to “sell everything” in response to COVID.
While this led to opportunities as the market had time to digest who the winners and losers of the pandemic would be, there was a strong rise in correlations due to the fight or flight response.
#7 Mathematics
The standard university formula for Correlation is:
Corr(a,b) = (a^2 + b^2 – c^2)/2ab
By simple (maybe not so simple?) arithmetic, when volatility rises, correlation rises.
The views expressed in this article are the views of the stated author as at the date published and are subject to change based on markets and other conditions. Past performance is not a reliable indicator of future performance. Mason Stevens is only providing general advice in providing this information. You should consider this information, along with all your other investments and strategies when assessing the appropriateness of the information to your individual circumstances. Mason Stevens and its associates and their respective directors and other staff each declare that they may hold interests in securities and/or earn fees or other benefits from transactions arising as a result of information contained in this article.
