
Yesterday, 14 October, we held our seventh quarterly Mason Stevens Credit Fund webinar update, where the call’s topic of discussion was broader and more macro-economic than ever.
The reason being?
Fixed income markets are a transparent gauge to assess price pressures, unemployment, demand for liquid assets, default risk, and corporate earnings over short, medium, and long-term time horizons.
This is part of the reason why fixed income is a well-regarded gauge of future expectations for public policy and private demand, because risk-free interest rates (government bonds) are a (mostly) unbiased estimator of the future demand for money, over many time frames.
Corporate bonds, however, trade at margins above government bonds, where the yield differential is the idiosyncratic difference of default risk between the company and the government.
i.e. the relative risk of buying a Westpac or Telstra issued bond compared to a Commonwealth government bond.
The Yield Curve
If every Australian government bond maturing from now until 2070 is graphed as a dot on a chart; then, by connecting the dots, we’re able to graph a yield curve like the following.
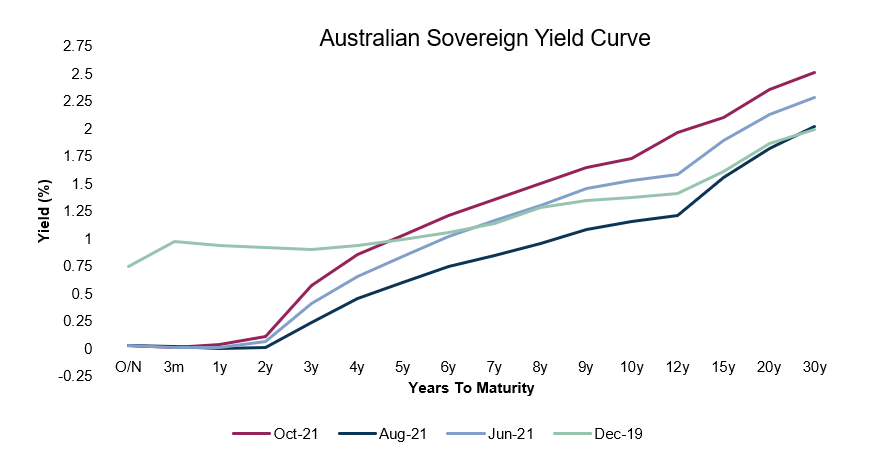
Source: Mason Stevens, Bloomberg
What the yield curve is telling us at present is that since the start of September (comparing the dark blue line to the magenta line), longer-term bond yields have risen and the yield curve has steepened on the back of economic re-opening, global inflationary pressures, and improved macroeconomic factors.
Because a lot of these changes are not immediate, they have tended to affect longer-term bond yields more than shorter-term, affecting the compound interest of bond returns, but also because shorter-term bonds yields are being actively targeted by central banks.
In Australia, the RBA continues to maintain our April 2024 government bond yield at 0.10%, the same as the Overnight Cash Rate.
The next bond along the Australian sovereign yield curve, our November 2024 government bond, is yielding 0.55% at present (14-Oct-2021), a 0.45% increase in the seven-month period.
Does this represent the market pricing in a high probability of two 0.25% cash rate hikes in this period?
Sort of.
If it wasn’t for the RBA’s yield curve control it’s likely the April 2021 government bond would be yielding above ~0.10% at present, likely between 0.15% to 0.40%.
However, the market is pricing in many different scenarios, where a 0.55% yield on the Nov 2024 govie represents a highly likely chance of a 0.50% cash rate at that point in time, and a small likelihood of a 0.75% cash rate, hence creating an average in between the two outcomes.
[Sidenote: in Australia, we tend to only forecast cash rate changes in 0.25% increments)
If we think about this mathematically, the yield of our September 2026 (5-year) govie is currently (as at 14-Oct-2021) trading at 0.99%, where for the next two years the cash rate will likely be 0.10%.
Therefore, for the bond to yield 0.99% over 5-years, it’s implying there will be a higher cash rate than 0.99% for a period during those 5-years (1% or higher), for the average to be 0.99%.
This might be a little optimistic an evaluation at present, given RBA Governor Lowe’s recent comments regarding these yields being well higher than RBA forecasts, but may also be correct if the market knows better than the RBA.
Inflation Expectations
The yield curve steepened because the general rise in prices of goods and services (inflation) has continued in a more sustained and less transitory fashion than originally forecast.
I myself fall into this camp where I foresaw inflation as being “transitory” where it was caused by supply bottlenecks that even 12 months later, have not fully abated.
In the below chart, US CPI (blue line) and Pricestats CPI (orange line) both show inflation in the US continuing to run >3% y/y, where there hasn’t been any major slow down as expected.
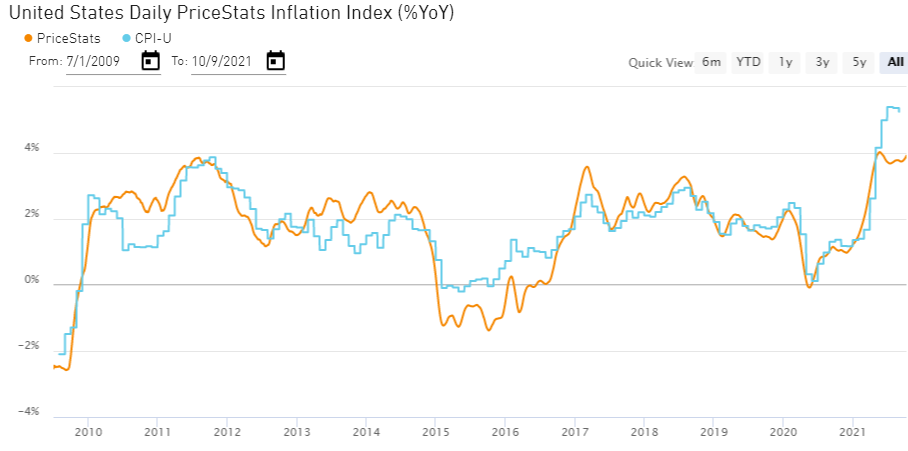
Source: Pricestats, State Street
While this may be “transitory” inflation as it’s non-permanent, we’re kidding ourselves if a “transitory” 12-36 month price spike across key products such as used cars, energy, and food costs doesn’t have a psychological effect on consumer and business behaviour for a period longer than the supply bottle-neck itself lasts.
To illustrate this point with an example, you may find that a total household income of $100,000 AUD was sufficient pre-COVID, before the price rises, allowing for a small amount of savings and for the occasional “surprise” expenses in hospital fees, vet bills or technology purchase.
If prices for key expenditure items – rent, fuel, utilities, food, etc – have price rises of 3% in 2021 and then by another 3% in 2022, while this may be transitory, you may find that $100,000 is now inadequate to cover the lifestyle experienced pre-COVID.
This would create the impetus for workers to ask employers for higher wages or to search for new employment that grants the lifestyle they are looking to maintain.
When this happens across industries, age brackets, and even multiple countries, it becomes a virtuous cycle of real (ex-ante) wage growth where aggregate demand shifts higher, creating further supply bottlenecks, and inflation continues.
As people expect inflation, it creates further inflation.
Thus, inflation is psychological.
Interest Rate Duration
As we’re at an inflection point where inflation may be seen by the majority as sustained rather than inflationary, it is creating volatility in bond markets – both government and corporate bonds, as higher interest rates have a relative effect on the relative return of bonds in our secondary market.
For example, a government bond yielding 1.5% makes a corporate bond yielding 2% less attractive than when the same government bond was yielding 1.0%.
If we continue to see inflation expectations enter investor’s longer-term investment horizons, then fixed-rate government and corporate bonds will likely continue to be adversely affected.
In the below chart we compare the Ausbond Composite Index (a mainly fixed-rate bond benchmark) versus the Ausbond FRN index (with near-zero exposure to long-term interest rates).
The Ausbond Composition returned -1.51% in September, while the FRN index was only -0.06%.
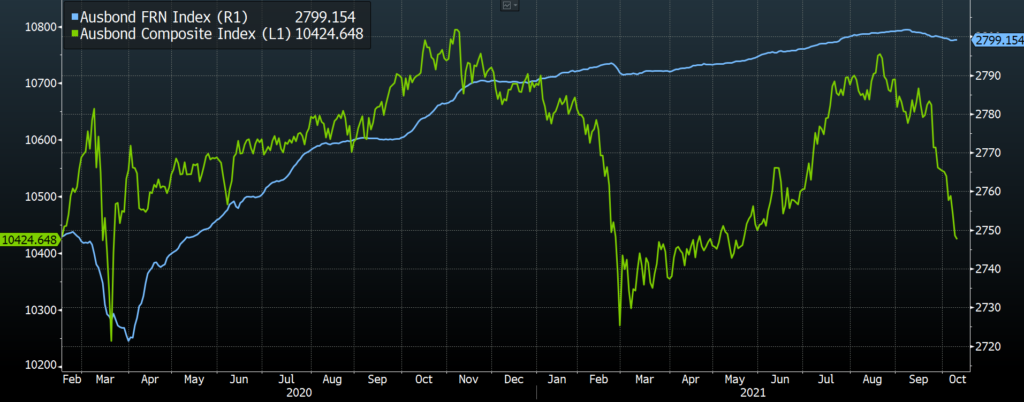
Source: Bloomberg
This epitomises that fixed-income investors may be benefitted from less fixed-rate sensitivity within portfolios, if/when interest rates continue to rise in coming weeks/months.
Moreover, fund managers (such as us) will continue to hedge our interest rate risk via interest rate futures markets, hedging our sensitivities to interest rate (bond yield) movements.
Industry Allocation
In positioning for potential rising inflation and the potential change in market inflation expectations, quickly becoming more prevalent around the globe, we’re positioning ourselves accordingly.
As longer-term readers of our morning notes and investors in our products know, we’ve enjoyed the benefits in the lesser-known and traded inflation-linked bond segment of our domestic fixed income market.
For example, in the past two years, an investor could purchase Sydney Airport, Royal Women’s Hospital, or Southern Cross Station issued infrastructure bonds, at a real yield of 1% or greater.
Given headline CPI is currently at 3.8% (Q2 2021), investors holding these bonds will enjoy an annualised 4.8% nominal return (3.8% CPI + 1% credit spread), a highly satisfactory return for domestic, investment grade, asset-backed fixed income.
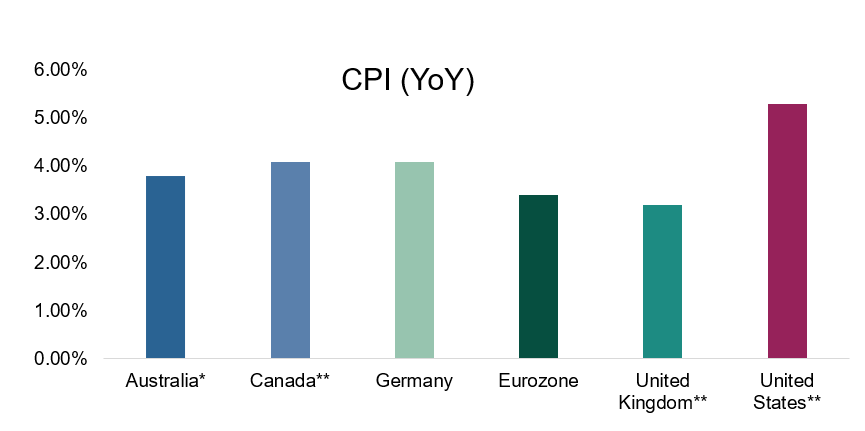
Source: Mason Stevens, Bloomberg, * June 2021, ** August 2021
Another way we’re able to position for future inflationary shocks is through exposure to domestic financial services issued bonds, such as those issues by NAB, CBA, ANZ etc.
As these institutions’ financial performance tends to be tied to their net interest margins, a steepening yield curve tends to be beneficial for their corporate earnings, where their bonds tend to be more defensive and maintain their value compared to other industries.
Future Performance
The great thing about fixed income as an asset class is that returns are highly predictable, where the majority of returns are derived from known income streams derived from coupon payments of bonds and floating-rate notes.
While not all bonds are made the same, there are many different ways to nuance our exposure to fixed income, to weather changes in the macro-economic environment and even benefit from the higher income from rising cash rates and bond yields.
Inflation-linked bonds, floating-rate notes, and limited interest rate duration may continue to be integral in portfolio construction, where nimble managers can continue to add value through active management.
For more information, you’re already reading this note in the correct place and can find additional information here.
Source: Mason Stevens, Morningstar
The views expressed in this article are the views of the stated author as at the date published and are subject to change based on markets and other conditions. Past performance is not a reliable indicator of future performance. Mason Stevens is only providing general advice in providing this information. You should consider this information, along with all your other investments and strategies when assessing the appropriateness of the information to your individual circumstances. Mason Stevens and its associates and their respective directors and other staff each declare that they may hold interests in securities and/or earn fees or other benefits from transactions arising as a result of information contained in this article.
