
A financial markets term that could just as easily be a heavy metal band name – a “death cross” – is a technical price chart formation when a security’s short-term moving average crosses below its long-term moving average.
Typically, the common moving averages are 30d and 50d moving average (MA) for short-term trends and 200d MA for longer-term averages.
We’re writing about it today as a death cross formation can be a reliable predictor for bear markets, where it has appeared recently in the price of copper, which has only happened five times in the past 30 years and each time signalled a significant slow-down in economic growth.
Conversely, the opposite of a death cross is called a “Golden Cross”, which has occurred 4x in the past 30 years and each time was strongly bullish for copper and economic growth.
Chart 1: 30-year Price Chart of Copper with 50d and 200d moving averages
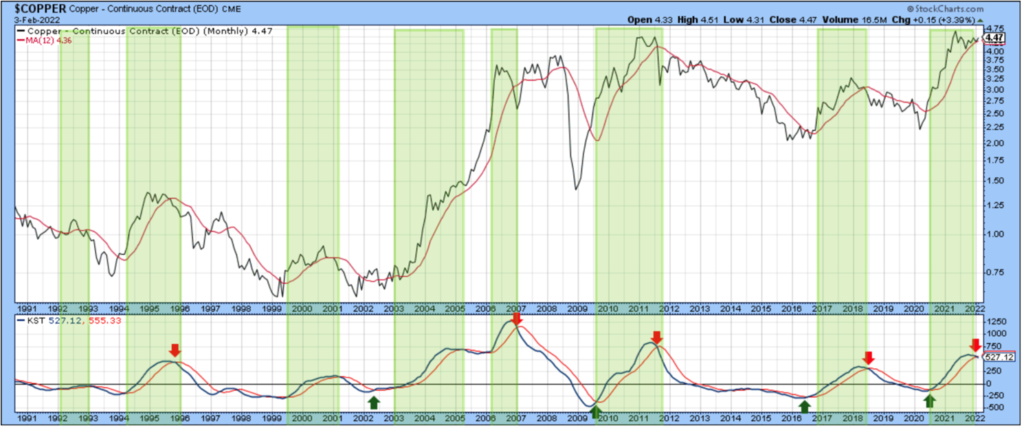
Source: Ned Davis Research
Utilisation as an Economic Indicator
This type of chart formation based upon price level interactions are also very similar to well-known and well-regarded indicators used in bond markets, such as the differential between 2y and 10y bonds (“2s10”).
While there’s nuanced differences, what we’re really doing is measuring forecasts or rates of change in bond yields (for the price of money) or copper prices (for demand for a widely used industrial metal) to proxy economic growth.
However, we avoid the lazy approach in statically applying a differential or moving average to provide certainty of future economic slowdown, as these static approaches often miss nuances in economic circumstances.
On the topic of which, the US Federal Reserve published a paper in May 2019 titled “There is No Single Best Predictor of Recessions”, as a response to the inversion of the US 2y-10y yields, where US 2y bond yields traded above 10y bond yields.
As an inversion of the US 2s10 is a fairly reliable indicator, commentators began to imitate Chicken Little that the sky was falling, world is coming to an end, imminent recession etc.
What the Fed asserts – as do we – that 2s10 is a robust indicator but there are certain dynamic relationships that also make other indicators preferential, at different times, depending upon circumstance.
Even within their analysis, they could see the differential between 1y and 10y bonds as a more reliable recession indicator – yet I’ve never once heard anyone else talk about 1s10 bond spreads…
Chart 2: US Federal Reserve Analysis of Best Bond Differentials for Recession Prediction
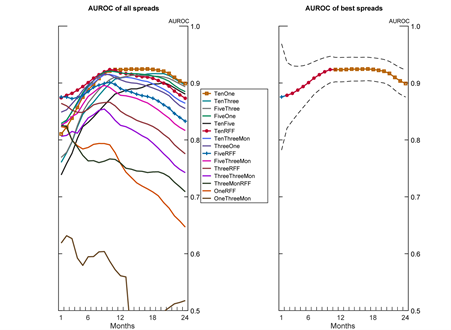
Source: US Federal Reserve
Likewise, there’s been instances where 10y and 30y bond spreads are more influential, or cash vs 20y or bonds versus futures etc.
Dynamic! Not static.
Back to Copper
Coming back to copper, the copper death cross is also a robust indicator for a deceleration in economic growth – particularly industrial growth – which is also a bit intuitive at the moment as fiscal and monetary stimulus dials down whilst global mobility hasn’t yet rebounded to pre-COVID levels.
Given short-term copper prices have fairly accurately predicted slowdowns in economic growth, talking about it today should put this on your radar as well.
Price Forecasting
The problem with a death cross price indicator – as opposed to a yield curve bond differential – is that prices are lagging indicators as opposed to bond yields which are forward looking prices.
For that, we can use LME derivative contracts, where 1m copper prices are SLIGHTLY higher than spot copper, but thereafter, 2–6-month copper forward prices are all lower, indicating a lower demand vs supply dynamic.
Chart 3: LME Copper Forwards Curve
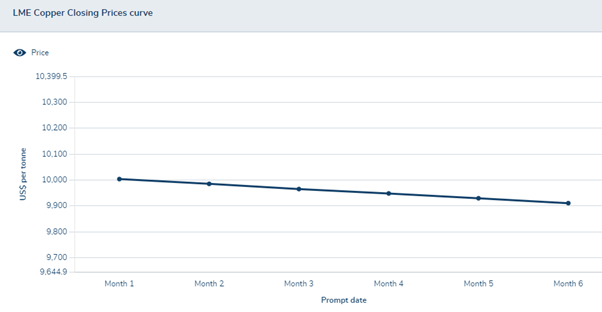
Source: London Metals Exchange, 16/Feb/2022
An Outlook
It’s interesting to read through copper and other industrial metals research where there are a number of conflicting price forecasts – and near total disagreement with the LME’s forward price curve.
Citi, for example, believe that copper will continue to experience its “super cycle” for the coming three to four years, underpinned by decarbonisation-related demand and challenged copper supply dynamics, cyclically bullish for metals consumption.
The bull case under this scenario is for copper to average $13,000 USD/tonne, and the bear case for the price to average $8,500 USD/tonne.
The reverse view that I’ve read in articles from mining.com and Reuters espoused expectations for copper price declines in CY2022 as economic growth tapers off in China and supply ramps up at the same time – something that’s yet to eventuate.
Looking at an LME survey for copper prices by CY2022 end, the average price is $9,000 USD/tonne according to 29 industry analysts, further below the current spot price of $9,968/tonne.
Exposure to Copper Prices
If we exclude BHP and RIO whose main sources of earnings are iron ore, there are two main ASX-listed copper producers that stand to win or lose from changing copper prices and levels of industrial production…though as you can imagine, there’s A LOT of companies that stand to lose from a slowdown in industrial production, especially if economic growth isn’t offset by another industry.
Those two companies are Oz Minerals (ASX: OZL) and Sandfire Resources (ASX: SFR).
Oz Minerals is an Australian miner focusing on copper, known for their Prominent Hill copper/gold mine and their Carrapateena copper/gold project based in South Australia, whilst Sandfire Resources operates as an exploration company whilst also mining copper and gold, based out of Perth.
Inconclusive Results
Coming back to the copper death cross that was the premise of this note, the indicator is highlighting a genuine slowdown in industrial demand at a time of restricted supply, where if the supply restrictions abated, we could expect a lower copper price (all else remaining equal).
Much like the past 2 years, CY2022’s trajectory seems to be predicated by central bank policy, fiscal stimulus and associated infrastructure spending, and more and more prominently, China’s demand for copper this year as they slowly exit a zero-COVID containment policy, and their growth rate ticks up.
Where time will tell if the copper death cross has highlighted a shorter, cyclical slowdown in industrial demand, or a longer-term secular stagnation.
The views expressed in this article are the views of the stated author as at the date published and are subject to change based on markets and other conditions. Past performance is not a reliable indicator of future performance. Mason Stevens is only providing general advice in providing this information. You should consider this information, along with all your other investments and strategies when assessing the appropriateness of the information to your individual circumstances. Mason Stevens and its associates and their respective directors and other staff each declare that they may hold interests in securities and/or earn fees or other benefits from transactions arising as a result of information contained in this article.
