

Over the past decade, Australian equities have delivered a solid, if slightly underwhelming absolute return of 7.67% p.a.1 What has been particularly noticeable, however, is the large underperformance when compared to international equities which have returned 13.09% p.a. 2 over the same period as illustrated in Chart 1.
Chart 1: International Equity Outperformance over Australian Equities Over The Past Decade
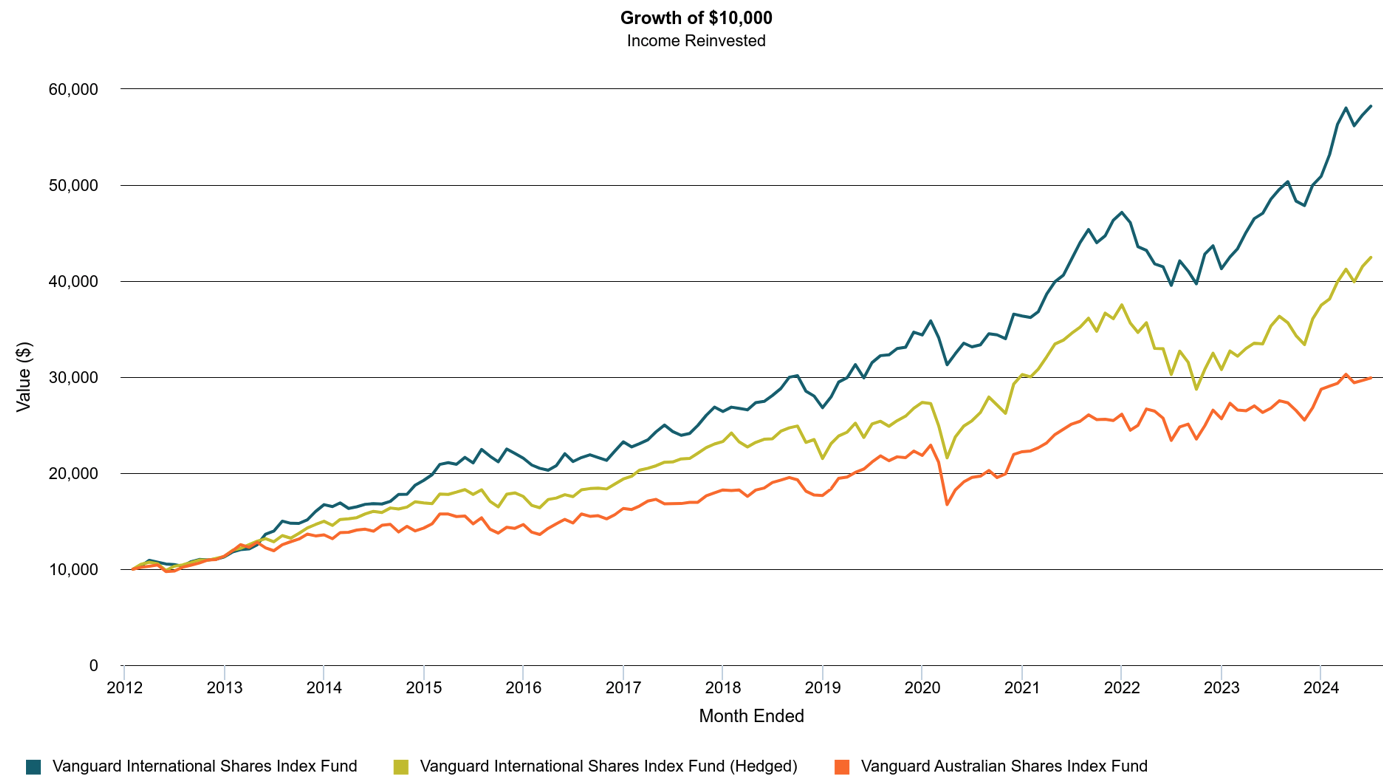
Source: Lonsec
This performance gap reflects the strong growth of the S&P500 and in particular the large technology companies that have come to dominate these indices. However, it also reflects a decade in Australia of very poor productivity, where economic growth was largely a function of strong immigration levels. These return series don’t of course capture the benefit of franking credits and after-tax returns for local investors, but even when making allowance for this, the performance difference between international and domestic equities remains large.
Of course this has not always been the case. In the first decade of this century, Australian equities meaningfully outperformed international equities as illustrated in chart 2 below. The after-effects of the Dotcom bubble in the US and the greater depths of the GFC experienced in international markets dragged international equity performance lower, while at the same time Australia disproportionately benefited from the Chinese led resources boom.
Chart 2: Australian Equities Outperformance Over International Equities Between the Dotcom Bubble and the GFC
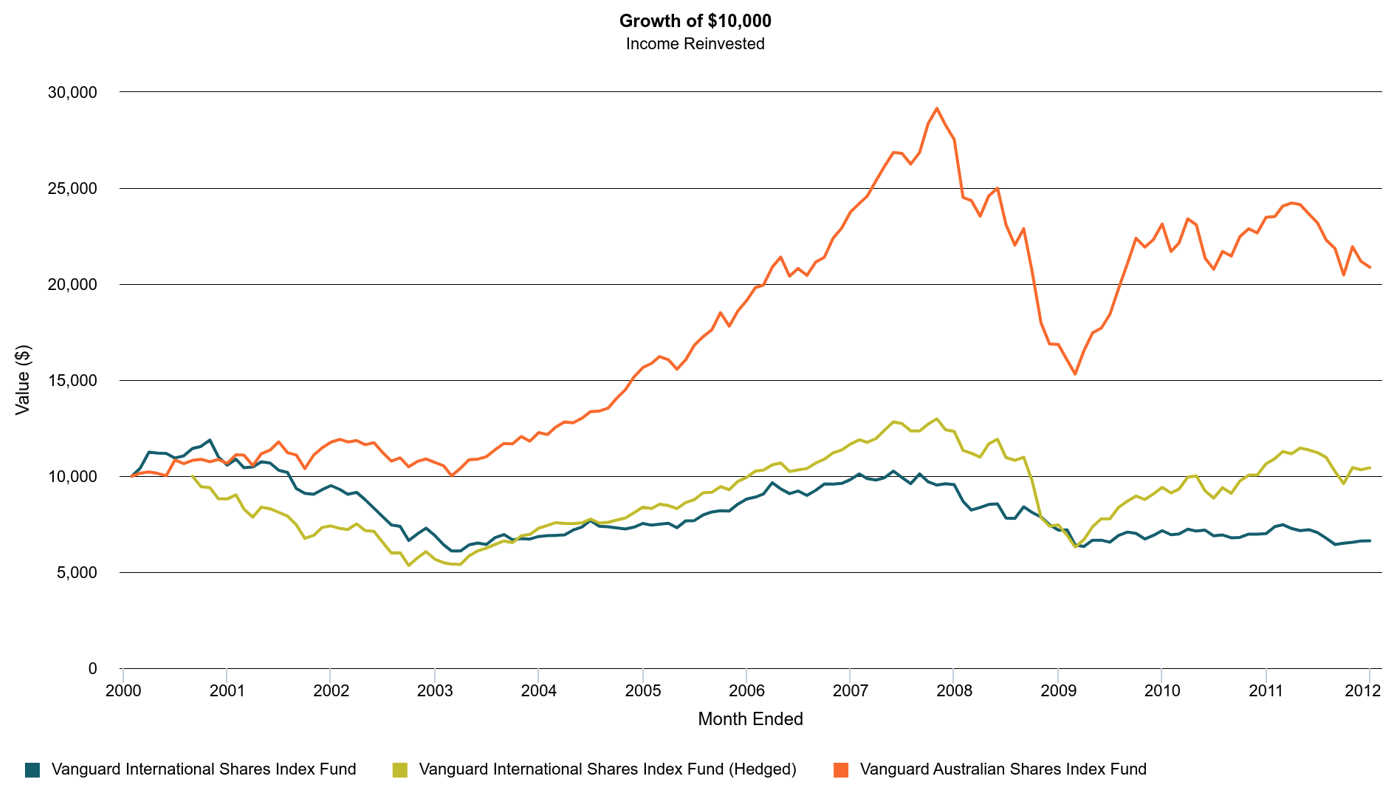
Source: Lonsec
Where will the returns from the beta of equity markets go in the next decade? Our long-term SAA forecasts, which consider returns over 7-10 years, have international and Australian equities at very similar levels, reflecting in part cheaper multiples in Australia but greater productivity in US markets. However, we acknowledge that these longer-term returns could take quite different paths in the short-medium term and could also be changed meaningfully by events and policy changes as yet unknown.
This background all provides context to make the argument that the search for consistent alpha remains relevant within equities and Australian Equities in particular. An allocation to Australian equities in a multi-asset portfolio remains logical for Australian investors, particularly given the tax considerations. Whether Australian equities continue to lag international equities in the next few years, however, is of course uncertain. If recent trends do continue though, alpha generation in your Australian equities portfolio may help bridge some of the performance gap, while obviously enhancing returns where beta meets or exceeds expectations.
Where are you sourcing your alpha?
We asked the same question in our international equity sector review given the increasing concentration into the largest technology companies globally, and the challenge that has presented to alpha generation in the short-term. Of course, in Australia we are very used to having a concentrated market, but it’s worth highlighting just how concentrated it is. While the Magnificent 7 constitute somewhere around 30% of the S&P500, our top 11 stocks locally make up more than 50% of the ASX200. 75% of the market cap of those 11 stocks are banks or mining companies. Given this concentration and the level of analyst coverage of both this market and these stocks, this is a highly efficient part of the market, where active returns would logically appear harder to come by.
The lower the market cap, the higher the alpha
While this has not always been true in international equities, Australian equities continue to follow quite a logical path of alpha being more achievable the further down the market cap spectrum you go, driven by the
relative lack of research coverage of smaller companies. Looking through some of the most successful, long standing large cap managers in the market, anyone delivering 1.5% p.a. or more net of fees alpha over the cycle is very much in a small elite group of outperforming managers. Of a group of 40 well-rated, long only managers with a track record of 7 years or longer, only 6 managers had generated alpha at or above 1.5% p.a. as at the end of June 2024. Our research process has reviewed the group of managers that have done this consistently, but just as importantly we have identified managers who we believe are well positioned to continue to deliver these alpha numbers going forward.
In the mid cap space, you can see an increase in the number of managers with 2-3% net of fee alpha, while in small caps the best managers have achieved 3-4% net of fee alpha over longer time frames. Not only are the alpha numbers larger but they are more consistent. Of a group 27 well rated, small cap managers with a track record of 7 years or longer, 17 of these managers have achieved alpha of 3% p.a. or greater over the 7 years to the end of June 2024.
What is clear is that the relative lack of coverage outside the top 20 stocks in Australia, and then outside the top 100 in an even more pronounced fashion, do present great alpha opportunities for the very best managers.
Of course, the decision about who or how to allocate is not as simple as overweighting small caps given the alpha potential. As chart 3 shows, small caps have struggled to keep up with large and mid-caps in recent years, and the ex-50 index has been the top performer.
This mid cap outperformance has been driven in part by a greater relative exposure to the technology and growth stocks that have rallied significantly post March 2020.
Chart 3: Mid and Large Cap Outperformance over Small Caps
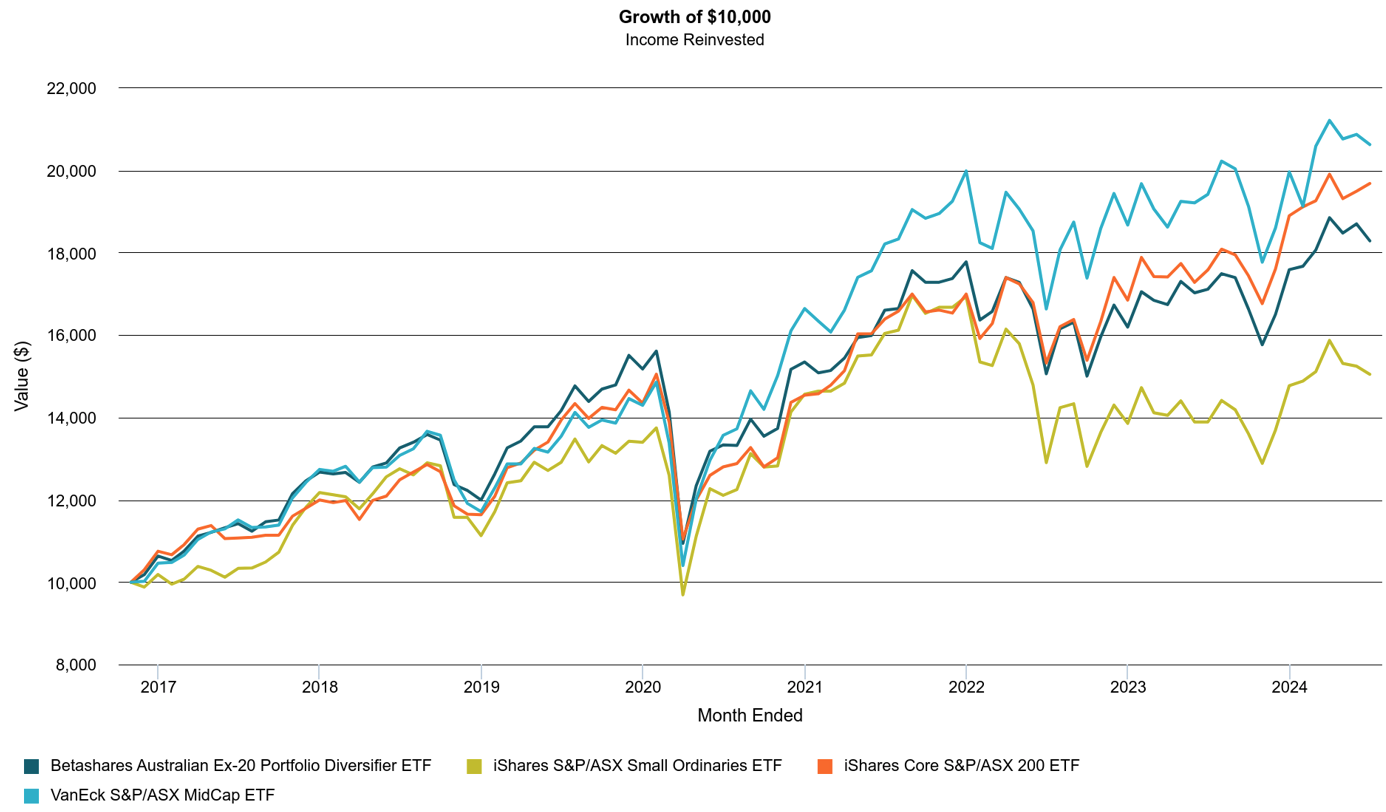
Source: Lonsec
Mid cap and small cap managers are on average more likely to generate alpha, but before you decide to overweight them in your portfolio you’ll need to think about your expectation of the market betas going forward. Will small caps close the underperformance gap of recent years? If you decide to make that allocation, small caps may continue to underwhelm for a while yet. An allocation to a good quality active manager, with the greater likelihood of alpha over the index through time, could at least bridge some of the gap to the overall asset class performance.
Beyond thinking about your mid and small cap allocations, extension strategies are another way to seek alpha. An extension strategy takes both long and short positions but aims to run at a market beta of approximately 1 and will typically be something like 130 long and 30 short. In this space, if you can find a manager with a strong long only strategy, and also a robust process with their shorting, then their capacity for alpha is in theory greater than a long only manager. Of course, given the greater market exposure there is also greater risk and potential downside with these managers, so doing the work to ensure the robustness of a managers’ process and risk management is paramount. Based on our research there is a small group of extension managers with long track records and strong evidence of investment skill and risk management, where 3-4% p.a. net of fee alpha has been achievable through time.
It is perhaps counterintuitive but alpha can work as something of an insurance policy against your beta exposures. If you can identify managers that can consistently deliver alpha over the long-term, then it can provide a degree of protection against an asset class or sub-asset class that subsequently underperforms. In our Australian Equity Sector Review document we detail the process we have undertaken to arrive at our highest conviction managers that we believe represent the best opportunities for alpha and risk adjusted returns going forward. If you are interested in finding out more please contact your Relationship Manager.
- Performance of the Vanguard Australian Shares Index Fund as at 30 June 2024 ↩︎
- Performance of the Vanguard International Shares Index Fund as at 30 June 2024 ↩︎
The views expressed in this article are the views of the stated author as at the date published and are subject to change based on markets and other conditions. Past performance is not a reliable indicator of future performance. Mason Stevens is only providing general advice in providing this information. You should consider this information, along with all your other investments and strategies when assessing the appropriateness of the information to your individual circumstances. Mason Stevens and its associates and their respective directors and other staff each declare that they may hold interests in securities and/or earn fees or other benefits from transactions arising as a result of information contained in this article.
