

We are nearing the end of the Aussie reporting season now, having seen over 80% of companies report (which makes up 90% of the market cap). Following on from the US earnings season last month, investors were interested to see if the “not as bad as feared” rhetoric would play out on local soil. Now that the majority of companies have reported we can look back at how corporates are performing in this high inflation environment.
Across the market results were skewed more towards in-line and beats than misses. Metrics like Sales, PBT (profit before tax), EPS (earnings per share) and DPS (dividend per share) produced a higher percentage of beat versus miss at a +3% / -3% level. The highlights of these metrics were EPS with a 33% beat (20% miss) and PBT with a 29% beat (21% miss).
The below chart looks at results EPS beats/misses across the market and sectors more specifically to give a greater breakdown of how the market has performed.
Chart 1: Result EPS beat/miss on overall market and sectors
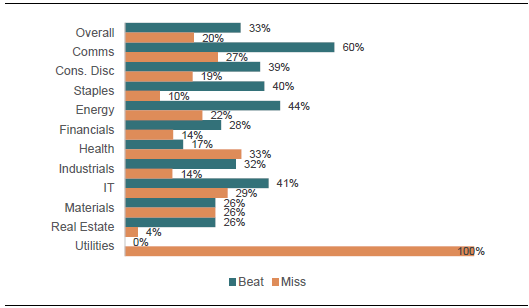
Source: Barrenjoey Research, Factset, Visible Alpha
Looking at results themselves, companies that beat, had positive returns on average of 2.6% to 3.5%. Downgrades and result misses were punished more heavily with returns ranging from -2.4% to -5.7%. A rather unusual feature of this reporting season has been the nature in which companies have underperformed in the days post result announcements. Companies that missed were sold off more than the beats – as expected, but the fact that so many traded lower was unusual. It looked as though companies that had traded well in the build up to their result were sold off, and those that hadn’t traded better.
Barrenjoey tracked this and found some rather interesting results. They dubbed this ‘PEAD’ (post earnings announcement drift). Positive PEAD companies were those that produced a positive move post results, while negative PEAD companies were those that had negative carry-on post result. Across the entire market thus far they found that 31% of the companies that had reported presented ‘positive PEAD’, while 55% presented ‘negative PEAD’. Breaking this down further to look at the S&P/ASX 100 compared to the S&P/ASX ex100 they saw the following:
- S&P/ASX 100: 40% presented positive PEAD while 57% presented negative PEAD
- S&P/ASX ex100: 27% presented positive PEAD while 54% presented negative PEAD
The result metrics mentioned earlier were more positive than negative, however when we look at the outlooks provided, they’re were not so positive. Changes to outlooks were skewed to the negative, with similar metrics to those mentioned above producing outlook changes as follows; PBT 22% upgrade (38% downgrade), EPS 18% upgrade (39% downgrade) and DPS 20% upgrade (36% downgrade). Sales bucked the outlook trend and was slightly positive with 17% upgrade (12% downgrade).
Chart 2 below is like chart 1; however, it looks at outlook EPS upgrades/downgrades across the market and the sectors.
Chart 2: Outlook EPS upgrade/downgrade overall market and sectors
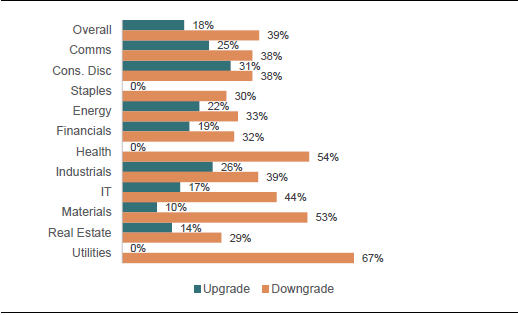
Source: Barrenjoey Research, Factset, Visible Alpha
So far this season we’ve seen analysts raise their cost forecasts by 1.2% across the ASX 200 (ex-financials), including upgrades to industrials and commodity producers of 1.4% and 0.9% respectively. In our view this increase in forecast costs is quite low when you consider where inflation is right now and where rates may need to go to bring inflation back towards the target band. The increase in costs was echoed on earnings calls with lots of commentary around heightened concerns in the rising costs of labour, interest rates and raw materials.
The below chart highlights how companies discussed their exposure to a variety of topics including rising costs in their earnings calls and whether the companies had a positive or negative tone when mentioning them, e.g. if 40 companies discussed the impact of raw material costs, of these 40: 10 did so in a positive tone and 30 in a negative tone, creating a net negative.
Chart 3: proportion of net positive/negative citations by ASX300 companies during the August 2022 earnings calls
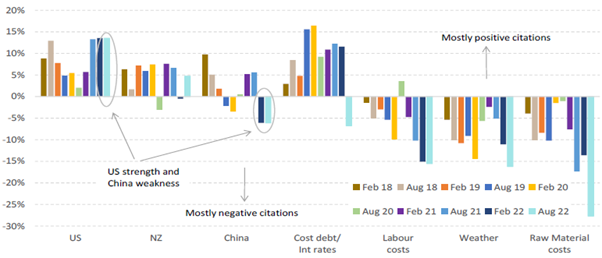
Source: MST Marquee, Company data, Factset
Rather unsurprisingly we saw companies comment negatively on labour costs and raw material costs, with cost of debt/interest rates also drawing negative comments – again unsurprisingly, thanks to the inflationary pressures companies are facing across the board. Majority of these comments were at their most negative in some time which could be viewed as an indicator of business sentiment being worse.
Overall, companies have held up better than expected with many investors heading into the season wary of how the companies would have fared in this challenging environment. We saw majority of companies report in-line results – with some having pre-released their results. Moving forward from here, the outlook still remains uncertain as businesses continue to battle with the inflationary pressures present in the economy right now.
The views expressed in this article are the views of the stated author as at the date published and are subject to change based on markets and other conditions. Past performance is not a reliable indicator of future performance. Mason Stevens is only providing general advice in providing this information. You should consider this information, along with all your other investments and strategies when assessing the appropriateness of the information to your individual circumstances. Mason Stevens and its associates and their respective directors and other staff each declare that they may hold interests in securities and/or earn fees or other benefits from transactions arising as a result of information contained in this article.
