When central banks lower cash rates and peg interest rates, they are lowering the price of money and time-value (appreciation rate), creating the economic incentive to borrow whether that be for consumption or investment.
For some, this will mean they consume more because the value of savings is diminished.
For others, they will borrow more as the cost of borrowing has been reduced.
For the rest, they will seek alternative investment opportunities to meet desired return targets.
In particular, emerging market (EM) fixed income has become a relevant investment opportunity with over 18.9 trillion USD of EM debt outstanding, low default rates, favourable valuations compared to developed market (DM) fixed income and higher yields.
As investors seek higher returns, we are seeing more and more people seek to blend portfolios with EM fixed income in order to achieve similar yields to what they were receiving in recent years (pre-COVID).


What are Emerging Markets?
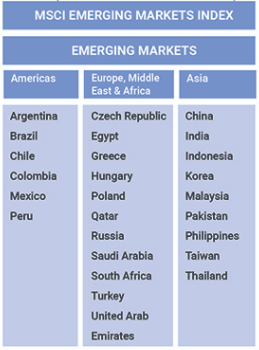
There are three types of market economies that investors use as broad categorisation.Frontier Markets > Emerging Markets > Developed MarketsAn emerging market economy is the economy of a developing nation that is becoming more engaged with global markets as they grow. Countries classified as EM are those with some, but not all, of the characteristics of a developed market. As an EM economy develops, it typically becomes more integrated with the global economy through access to their capital markets, more liquidity and the development of modern/developed regulatory institutions. MSCI are one of the most widely distributed and used index providers and produce an annual Global Market Accessibility Review which is used around the world as a gauge for which nations are improving/diminishing.

Source: MSCI
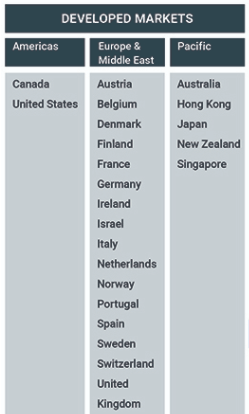
This is distinct from what we consider Developed Markets.
Source: MSCI
Why are Emerging Markets an opportunity?
As EM nations are in a transition from developing markets to developed markets, the journey is generally a story of low wages and lower GDP to utilising technology and modern industrial practices to generate a higher standard of living. As developed nations have already gone through this growth process, EM nations are an opportunity to invest in suitable countries that are embarking on rapid expansion programmes to bring about potential wealth and prosperity. In terms of fixed income, this higher growth and inflation narrative is associated with higher yields and incomes, though also higher risks than Developed Markets (DM). It should be noted that when analysing EM debt, there are two main types of issuance:- Issuance in Local Currency – i.e. Russia issues debt in RUB, South Africa issues debt in ZAR, Brazil issues debt in BRL, South Korea issues debt in KRW and so on.
- Sometimes called ‘soft’ currency or local debt
- Issuance in USD currency
- Called ‘hard’ currency or ‘external’ debt
- Countries will often issue in USD to gain greater access to capital markets, specifically international capital where investors are not from that nation
Reasons for allocating capital
Investors are looking at emerging market fixed income investments because of the interest rates these bonds yield, but also for markets that can be uncorrelated or decorrelated with DM economies. For example, Chinese Government Bonds (CGBs) yield close to 3% and over the last 2-3 years have been uncorrelated with DM nations such as the USA, Japan and the EU. On top of this, higher quality Chinese corporates can yield 4-5% p.a.Defensive characteristics but still with yield
Bonds remain a key component of multi-asset portfolios and government bonds remain a bedrock for portfolio construction – though their allocations are slowly waning due to lower for longer interest rate policy. This isn’t to say that EM bonds such as Chinese government bonds are a substitute for higher-grade governments issued by Australia, Germany, France, USA etc., but they do exhibit defensive qualities more associated with this type of asset allocation. Following on with my China example, tracking 10-year government bonds issued by USA (blue), Australia (green) and China (red), we can see that Chinese government bonds did not experience the volatility that Australia and US bonds did during the market turmoil in March of this year.
Source: Bloomberg
Moreover, when looking at these bonds over a 5-year history, we can see that Chinese bonds roughly yield the same today as in 2015, around 3%. Whereas AU 10 government bonds yielded 2.6% and now yield 0.90%.
Source: Bloomberg
EM as a whole but not as a hole in performance
It could be a logical fallacy for an investor to see EM fixed income as an opportunity, grouping all the nations together as a group, which ignores their idiosyncratic differences. These idiosyncrasies are more pronounced in EM than DM, because of their different points along their journeys to becoming developed market economies. For example, the South Korean bond market is more developed than the Indonesian or Thailand bond markets, and we saw this outperformance in March/April when South Korean government bonds rallied, whereas other EM nation’s debt sold-off. Also, countries that are more sophisticated such as Poland, Czech Republic, Chile as well as South Korea and China are seeing more attention because they have larger and more liquid capital markets. This tends to make them more stable and less volatile than other EM nations. An investor must also have a view on currency risk, as buying EM debt denominated in the local currency could be a positive or negative depending on the performance of the local currency. During COVID-19, it has generally been a negative for EM nations versus developed markets, where we saw a “flight to quality” and thus EM currencies sold-off as a result it’s generally easier to sell the currency than liquidate the underlying asset. Comparatively, EM debt denominated in USD was viewed more favourably compared to the local currency issuance, and not subject to the performance of the local currency. Specifically, countries such as Poland, Czech Republic, Israel, Singapore, South Korea, Chile as well as China have yields around 5%. It’s this 5% target area where I focus more attention right now.Next steps
There are many indexes that track Emerging Markets (not just fixed income) as this has been a topic of interest to sophisticated investors since the late 80s/early 90s. However, due to the advances of financial literacy, availability of knowledge and availability of financial products such as managed funds and exchange-traded funds (ETFs), there is ever-increasing ability for investors to find solutions for EM allocations. I mention availability of knowledge as EM was once a realm of needing to travel to the country of allocation and pursue due diligence on the ground. Contemporarily, an investor has a similar knowledge of the nation via various internet-based information sources. For example, JP Morgan Emerging Market Bond Index (EMBI) was formed in the early 1990s with the inclusion of USD denominated bonds issued by Latin American governments – then called “Brady Bonds” after the US Treasury Secretary at the time. Based on this EMBI, there are ETFs such as iShares issued EMB (NYSX) or IHEB (ASX) that seek to replicate the index, on a broad basis. Alternatively, there are also “active” based ETFs such as VanEck’s EBND (ASX) that is benchmarked against the EMBI but seeks to actively outperform it. Out of interest, the largest five exposures at 31 August were Argentina, Indonesia, Mexico, Uruguay and China – I’d expect several nations that a vast number of people have no exposure. On the managed funds side, there are EM options from the likes of Platinum, Franklin Templeton, Fidelity and Aberdeen – to name but a few – that have different characteristics.Final remarks
Emerging Markets debt is growing in focus because of the higher yields available than can be found in Developed Markets, coupled with some defensive characteristics. It may not be on your radar today but may be in the future. Not to mention, these nations are developing and may be developed nations in the future.The views expressed in this article are the views of the stated author as at the date published and are subject to change based on markets and other conditions. Past performance is not a reliable indicator of future performance. Mason Stevens is only providing general advice in providing this information. You should consider this information, along with all your other investments and strategies when assessing the appropriateness of the information to your individual circumstances. Mason Stevens and its associates and their respective directors and other staff each declare that they may hold interests in securities and/or earn fees or other benefits from transactions arising as a result of information contained in this article.


