
“Who’s to blame for the lives that tragedies claim,
No matter what you say,
It don’t take away the pain”
P.O.D. [2001]
In Australia, we’ve been relatively lucky that our Commonwealth government has given Australians clarity of government benefits until March 2021.
In the USA, they aren’t so lucky.
As I write, Americans wait for Congress to negotiate an extension to the current benefits – and it has been suggested the White House can declare a state of emergency to temporarily freeze pay-roll taxes.
To quantify, there are 30mln US persons collecting the benefits, or $600 USD per week – 18bln USD per week provided by the government.
That’s 72bln per month.
That’s 216bln over the last three months.
That’s a lot of money that some companies – such as Amazon, Apple, Facebook and Google – have been getting. Something we wrote about on Monday (3 August).
According to the University of Chicago, 68% of those collecting this money have received higher incomes than what they made prior to COVID-19, with a median increase of 34%.
Some of the ideas being floated are to reduce the $600/wk payment to $200, or to reduce it to $300 by October.
It is likely that an extension happens – but the amount may vary.
Productivity
It is important to note that productivity has been dropping for the last two years before the current pandemic.
The rate of change of economic output – the change in productivity, has been dropping and the global economy was slowing.
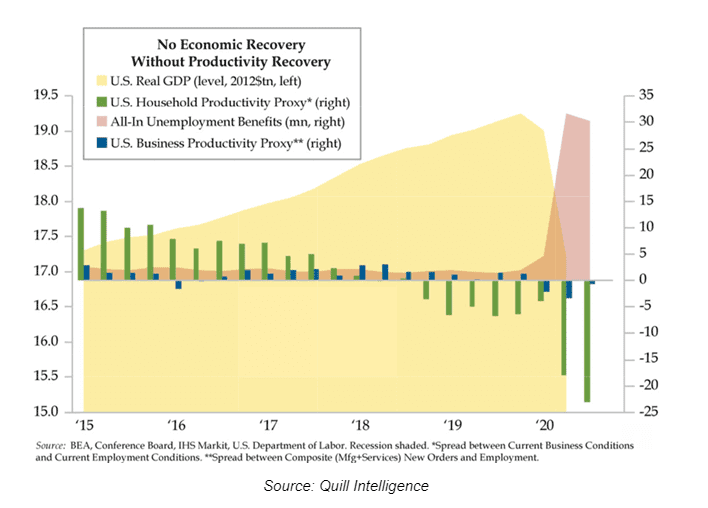
However, what is very noticeable is that whilst household/individual productivity was slowing, business productivity began to decline in Q4 2019 as COVID-19 started to emerge in China.
If you’re aware of the US versions of JobKeeper and JobSeeker – Paycheck Protection Program (PPP) – you may be aware that it provided liquidity to companies that have access to global capital markets – through raising debt and equity – but not to those smaller companies in any readily usable form.
The US Chamber of Commerce estimates that over 100,000 small business in the US are going to be closed for good by the end of August – and with that recovery will take years.
Long bonds
We wrote about what “real” interest rates are telling us yesterday.
And people ask me all the time, why would I buy bonds – let alone government bonds – when yields are so low?
Here’s why: because we buy safe-haven assets when we believe the price will go up further.
In a simple analysis I’ve conducted, I compare the 1y, 3y and 5y returns of 5y, 10y, 30y US Treasury bonds with the S&P 500. The result is that bonds have clearly outperformed equities during this time, as interest rates have fallen due to lagging economic growth and a disinflationary price environment.
Performance comparison – cumulative performance
| 1y performance | 3y performance | 5y performance | |
| S&P 500 Index | 12.37% | 33.02% | 56.60% |
| 5y US Treasury | 88.04% | 88.10% | 85.71% |
| 10y US Treasury | 72.4% | 75.84% | 74.57% |
| 30y US Treasury | 51.22% | 57.52% | 57.5% |
* As at 4 August 2020
The performance is clearly that US treasuries have out-performed in the last year – having broken-even over the previous 4-year period from 2015-2019 where interest rates rose – and bond prices declined.
In the graph below, you can see the 10y Treasury (blue) vs the S&P 500 (red) below for the 5-year period.
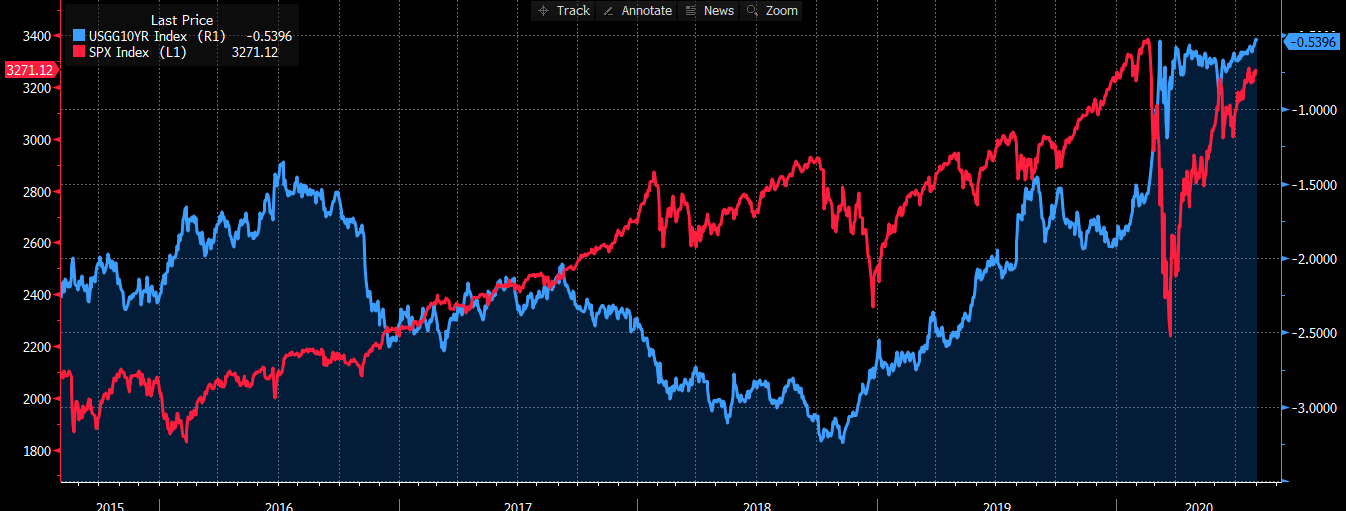
Source: Bloomberg
Interest Rate Exposure & Convexity
At this point, I wish to “step back” and muse as to why I’m highlighting the out-performance of government bonds compared to equities.
I’m using these examples to show how exposure to interest rate movements has benefited portfolios – whether they are in “risk-free” assets such as treasury bonds – or in longer-dated credit bonds that have embedded exposure.
And what this interest rate exposure does at lower prevailing levels of yield is expose investors to convexity – a magical word of great power.
When interest rates are low, each incremental yield decrease equates to a larger price increase in bonds.
I.e. the price appreciation gain for every basis-point drop in a bond yielding 0.88% has a higher price change than for a bond yielding 5.0%.
You can see that as the bond yield increase in the below graphic representation – the convexity curve flattens out.
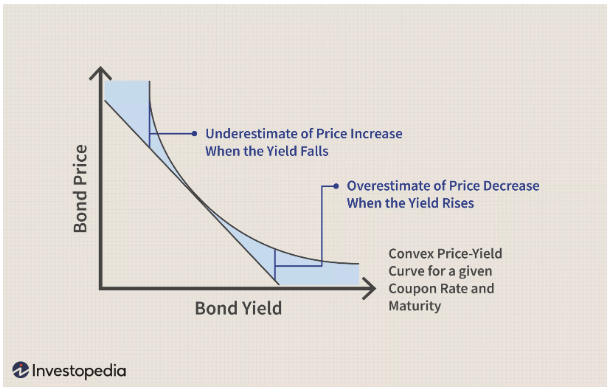
However, convexity works both ways – if interest rates sell off, there’s a greater sensitivity for prices to decline as well.
Where to from here?
Inflation and deflation are about supply vs demand.
COVID-19 has created a situation where there is an excess supply capacity around the world, whilst there’s reduced demand.
Naturally (and assuming no further increased government intervention), prices will find lower levels to “market clearing levels” so that the excess supply can be consumed/reduced.
The persistent or sustained decrease in prices is called deflation – and deflation is likely to see a flattening of yield curves and further declines in nominal interest rates.
Exposure to interest rates and the embedded convexity may further benefit portfolios – even when yields are at historic low levels.
The views expressed in this article are the views of the stated author as at the date published and are subject to change based on markets and other conditions. Past performance is not a reliable indicator of future performance. Mason Stevens is only providing general advice in providing this information. You should consider this information, along with all your other investments and strategies when assessing the appropriateness of the information to your individual circumstances. Mason Stevens and its associates and their respective directors and other staff each declare that they may hold interests in securities and/or earn fees or other benefits from transactions arising as a result of information contained in this article.
